Filters and interface groups

Junos filters are well known and widely used in order to control which traffic to accept on a device.

Normally, we crate a filter and apply it to an interface.
Alternatively, we might create an interface-specific filter and apply it to multiple interfaces and get per-interface counters.

There is another option where we configure a filter at a “higher level” (we will see what I mean) and control traffic to be accepted/discarded/counted based on so-called interface groups.

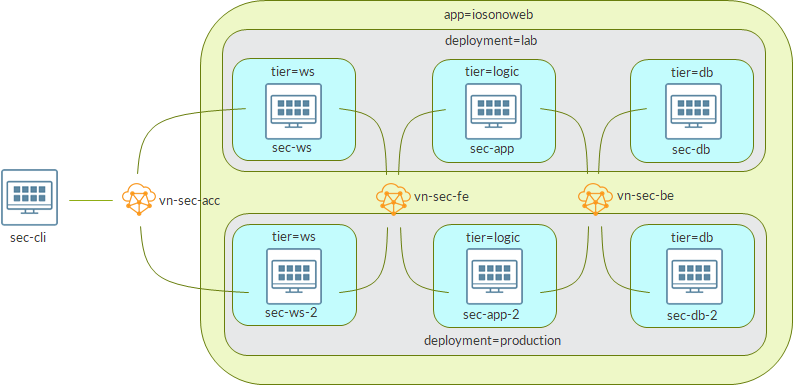
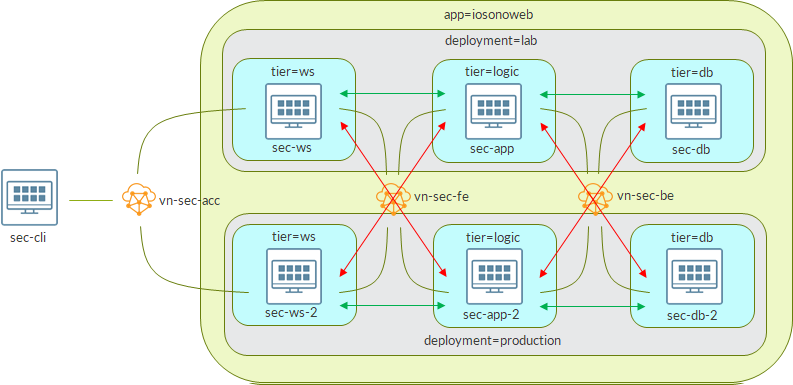
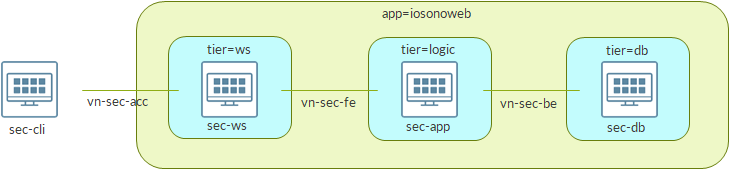
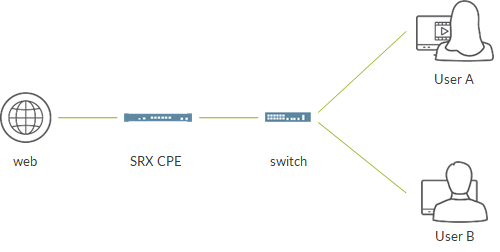
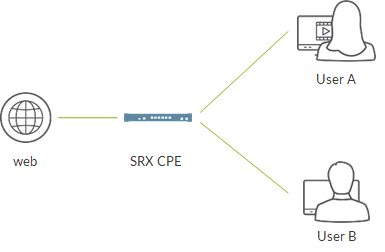
To understand how this works, let’s consider the following topology:

We are going to focus on the router at the top.

That router as 3 interfaces:

  • one interface is assigned to group 1 (blue)
  • one interface is assigned to group 2 (red)
  • one interface does not belong to any group

Let’s have a look at router basic configuration.

set interfaces ge-0/0/0 unit 0 family inet filter group 1
set interfaces ge-0/0/0 unit 0 family inet address 192.168.0.1/31
set interfaces ge-0/0/1 unit 0 family inet filter group 2
set interfaces ge-0/0/1 unit 0 family inet address 192.168.1.1/31
set interfaces ge-0/0/2 unit 0 family inet address 192.168.2.1/31
set interfaces lo0 unit 0 family inet address 10.10.10.10/32

Notice, interfaces ge-0/0/0 and ge-0/0/1 are assigned to groups.
This is a small lab; in a real environment the idea is to have many interfaces mapped to few groups.

As said before, ge-0/0/2 is not assigned to any group.

Next, we run OSPF and BGP over those interfaces:

set routing-options autonomous-system 100

set protocols bgp group ibgp type internal
set protocols bgp group ibgp local-address 10.10.10.10
set protocols bgp group ibgp neighbor 1.1.1.1
set protocols bgp group ibgp neighbor 2.2.2.2
set protocols bgp group ibgp neighbor 3.3.3.3

set protocols ospf area 0.0.0.0 interface lo0.0 passive
set protocols ospf area 0.0.0.0 interface ge-0/0/0.0 interface-type p2p
set protocols ospf area 0.0.0.0 interface ge-0/0/1.0 interface-type p2p
set protocols ospf area 0.0.0.0 interface ge-0/0/2.0 interface-type p2p

Now, time to build the filter:

set firewall family inet filter filter-group term no-icmp from interface-group 2
set firewall family inet filter filter-group term no-icmp from protocol icmp
set firewall family inet filter filter-group term no-icmp then count no-icmp
set firewall family inet filter filter-group term no-icmp then discard
set firewall family inet filter filter-group term no-bgp from interface-group 1
set firewall family inet filter filter-group term no-bgp from protocol tcp
set firewall family inet filter filter-group term no-bgp from port 179
set firewall family inet filter filter-group term no-bgp then count no-bgp
set firewall family inet filter filter-group term no-bgp then discard
set firewall family inet filter filter-group term no-ssh from interface-group 2
set firewall family inet filter filter-group term no-ssh from protocol tcp
set firewall family inet filter filter-group term no-ssh from port 22
set firewall family inet filter filter-group term no-ssh then count no-ssh
set firewall family inet filter filter-group term no-ssh then discard
set firewall family inet filter filter-group term no-telnet from interface-group 1
set firewall family inet filter filter-group term no-telnet from protocol tcp
set firewall family inet filter filter-group term no-telnet from port 23
set firewall family inet filter filter-group term no-telnet then count no-telnet
set firewall family inet filter filter-group term no-telnet then discard
set firewall family inet filter filter-group term default then count default
set firewall family inet filter filter-group term default then accept

Let’s analyze term no-icmp. Understanding how it works will help us getting familiar with the whole mechanism:

set firewall family inet filter filter-group term no-icmp from interface-group 2
set firewall family inet filter filter-group term no-icmp from protocol icmp
set firewall family inet filter filter-group term no-icmp then count no-icmp
set firewall family inet filter filter-group term no-icmp then discard

The goal if this term is to discard icmp packets…but not any icmp packets, only packets entering interfaces belonging to group 2. In our scenario, only packet coming from ge-0/0/1.

Last, we need to apply this filter. As said, before, we do this at a “higher level”, not on one or more specific interfaces:

set forwarding-options family inet filter input filter-group

Device is ready, time to verify things are working as expected.

Let’s start from ospf. Our filter tells nothing about OSPF so it should work on all the interface:

root@star_re> show ospf neighbor
Address          Interface              State     ID               Pri  Dead
192.168.0.0      ge-0/0/0.0             Full      1.1.1.1          128    39
192.168.1.0      ge-0/0/1.0             Full      2.2.2.2          128    35
192.168.2.0      ge-0/0/2.0             Full      3.3.3.3          128    32

BGP instead, is blocked on group 1 (ge-0/0/0, affecting session to 1.1.1.1):

root@star_re> show bgp summary
Threading mode: BGP I/O
Groups: 1 Peers: 3 Down peers: 1
Table          Tot Paths  Act Paths Suppressed    History Damp State    Pending
inet.0
                       0          0          0          0          0          0
Peer                     AS      InPkt     OutPkt    OutQ   Flaps Last Up/Dwn State|#Active/Received/Accepted/Damped...
1.1.1.1                 100          0          0       0       1     2:09:01 Connect
2.2.2.2                 100        309        307       0       0     2:17:42 0/0/0/0              0/0/0/0
3.3.3.3                 100        279        277       0       1     2:03:53 0/0/0/0              0/0/0/0

What about ICMP?

Interface ge-0/0/1 (group 2, connecting to MX2) should discard packets.

MX2 cannot ping anybody:

root@mx2_re> ping 10.10.10.10
PING 10.10.10.10 (10.10.10.10): 56 data bytes
^C
--- 10.10.10.10 ping statistics ---
3 packets transmitted, 0 packets received, 100% packet loss

root@mx2_re> ping 1.1.1.1
PING 1.1.1.1 (1.1.1.1): 56 data bytes
^C
--- 1.1.1.1 ping statistics ---
3 packets transmitted, 0 packets received, 100% packet loss

MX1 can ping anyone but MX2:

root@mx1_re> ping 10.10.10.10
PING 10.10.10.10 (10.10.10.10): 56 data bytes
64 bytes from 10.10.10.10: icmp_seq=0 ttl=64 time=4.571 ms
64 bytes from 10.10.10.10: icmp_seq=1 ttl=64 time=9.218 ms
^C
--- 10.10.10.10 ping statistics ---
2 packets transmitted, 2 packets received, 0% packet loss
round-trip min/avg/max/stddev = 4.571/6.894/9.218/2.324 ms

root@mx1_re> ping 3.3.3.3
PING 3.3.3.3 (3.3.3.3): 56 data bytes
64 bytes from 3.3.3.3: icmp_seq=0 ttl=63 time=39.973 ms
64 bytes from 3.3.3.3: icmp_seq=1 ttl=63 time=6.027 ms
^C
--- 3.3.3.3 ping statistics ---
2 packets transmitted, 2 packets received, 0% packet loss
round-trip min/avg/max/stddev = 6.027/23.000/39.973/16.973 ms

root@mx1_re> ping 2.2.2.2
PING 2.2.2.2 (2.2.2.2): 56 data bytes
^C
--- 2.2.2.2 ping statistics ---
3 packets transmitted, 0 packets received, 100% packet loss

This is correct as echo replies from MX2 are discarded by our filter.

This tells us that our filter acts on both traffic to the RE and transit traffic.

Similar results for telnet (blocked on group 1, ge-0/0/0):

root@mx1_re> telnet 10.10.10.10
Trying 10.10.10.10...
^C
root@mx1_re> telnet 2.2.2.2
Trying 2.2.2.2...
^C

root@mx2_re> telnet 10.10.10.10
Trying 10.10.10.10...
Connected to 10.10.10.10.
Escape character is '^]'.
login:
telnet> q
Connection closed.

root@mx2_re> telnet 1.1.1.1
Trying 1.1.1.1...
^C

Please notice, telnet is blocked in any direction (MX1 -> MX2 and MX2 -> MX1). This is because the filter uses “from port 22”. We might allow a specific direction by changing the filter to something like “from destination-port 23” or “from source-port 23”.

We omit ssh verification as the mechanism is the same and should be clear by now 🙂

Of course, we can check counters to know how much traffic we discarded:

root@star_re# run show firewall

Filter: __default_bpdu_filter__

Filter: filter-group
Counters:
Name                                                Bytes              Packets
default                                           9088126                45002
no-bgp                                              89871                 1559
no-icmp                                              2016                   24
no-ssh                                                688                   12
no-telnet                                             624                   10

Counters are aggregate ones; we do not have per-interface data.

Before concluding, there is still one thing worth looking at.

With the above examples, we have seen filter acts on both transit traffic and traffic destined to the RE.

Let’s change the config:

root@star_re# show forwarding-options
family inet {
    filter {
        input filter-group;
    }
}

[edit]
root@star_re# delete forwarding-options

[edit]
root@star_re# set interfaces lo0.0 family inet filter input filter-group

[edit]
root@star_re# commit
commit complete

Protocols look like before:

root@star_re> show ospf neighbor
Address          Interface              State     ID               Pri  Dead
192.168.0.0      ge-0/0/0.0             Full      1.1.1.1          128    38
192.168.1.0      ge-0/0/1.0             Full      2.2.2.2          128    33
192.168.2.0      ge-0/0/2.0             Full      3.3.3.3          128    37

root@star_re> show bgp summary
Threading mode: BGP I/O
Groups: 1 Peers: 3 Down peers: 1
Table          Tot Paths  Act Paths Suppressed    History Damp State    Pending
inet.0
                       0          0          0          0          0          0
Peer                     AS      InPkt     OutPkt    OutQ   Flaps Last Up/Dwn State|#Active/Received/Accepted/Damped...
1.1.1.1                 100          0          0       0       1     2:20:41 Active
2.2.2.2                 100        335        333       0       0     2:29:22 0/0/0/0              0/0/0/0
3.3.3.3                 100        305        303       0       1     2:15:33 0/0/0/0              0/0/0/0

Let’s try icmp:

root@mx2_re> ping 10.10.10.10
PING 10.10.10.10 (10.10.10.10): 56 data bytes
^C
--- 10.10.10.10 ping statistics ---
4 packets transmitted, 0 packets received, 100% packet loss

root@mx2_re> ping 1.1.1.1
PING 1.1.1.1 (1.1.1.1): 56 data bytes
64 bytes from 1.1.1.1: icmp_seq=0 ttl=63 time=3.171 ms
64 bytes from 1.1.1.1: icmp_seq=1 ttl=63 time=14.114 ms
^C
--- 1.1.1.1 ping statistics ---
2 packets transmitted, 2 packets received, 0% packet loss
round-trip min/avg/max/stddev = 3.171/8.643/14.114/5.472 ms

There is a difference!
Traffic to RE (10.10.10.10) is blocked while transit traffic is allowed.
This is because filter is now applied to lo0 interface so it affects traffic destined to RE only.

Through this mechanism we can build a more granular Protect-RE filter.

Why more granular?

Look at our example. With a standard Protect-RE filter, we would block any icmp traffic reaching the RE. Here instead, we can decide to block only icmp traffic coming from specific interfaces (based on configured groups). Same goes for routing protocols and anything else. Moreover, we can decide that some interfaces are “trusted” and allow anything coming from there (here, interface ge-0/0/2 from MX3).

Is this the way to go to build our Protect-RE filter? As usual, it depends on the context and the requisites…but, as usual, it is important to know al the options we have in order to pick the best one for our given scenario.

Ciao
IoSonoUmberto

Pre-staging SRX devices before CSO ZTP onboarding

Starting with this post, I’ll go through all the necessary steps to create a spoke site within CSO.

Since CSO 6.0, it is possible to use ZTP to onboard a SRX cluster and have CSO to create the cluster.

The following image shows a high level overview of this use-case:

We assume some elements are already in place:

  • Enterprise HUB, a cluster of two SRX4100
  • CSO runs in a cloud instance
  • OAM hubs added to CSO
  • two networks between spoke and hub, internet and mpls

We are going to create the spoke site and we expect CSO to perform the following operations:

  • create cluster
  • enable OAM IPSEC tunnels towards OAM hubs (so to allow spoke site to reach CSO)
  • enable data IPSEC tunnels towards Enterprise hub
  • configure additional service configuration

 In the beginning, the two SRX1500 are standalone devices.

By design, dual CPE use-case works in active-active mode on the wan side. This means that wan0 (reth0) will be configured on node0 only while wan1 (reth1) will be configured on node1 only. In other words, reth interfaces are distributed over the two nodes and each reth interface has its members belonging to a single node so that each reth interface is somehow bound to a specific node.

In our example, wan interfaces are ge-0/0/10 on both nodes:

  • ge-0/0/10 on node0 will be wan0 and is connected to the internet network
  • ge-0/0/10 on node1 will be wan1 and is connected to the mpls network

As both devices must reach the redirect server to start the ZTP process, we need both networks to be able to reach the Internet; even wan1 has somehow to reach the redirect server running somewhere in the Internet.

If this was not possible, then we should perform some pre-staging configuration in order to tell the SRX to use CSO as phone-home server, bypassing the redirect server. After all, redirect server simply tells the srx the actual phone-server (CSO instance) it has to contact. If we know that information in advance, we can skip the dialogue with the redirect server, removing the requirement to have the mpls network able to reach the Internet. This is usually easier with a CSO on-premises installation as we know exactly the IP address (or URL) of the CSO instance. However, in this case, even if the mpls network does not have to reach the Internet, it has to be able to reach the CSO instance.

Here, both wan links are able to reach the Internet and the redirect server.

Before provisioning, the site, we need to prepare the two devices.

The ZTP process makes some assumptions:

  • port ge-0/0/0 is used as wan link and can get an address via dhcp
  • port xe-0/0/19 is used as fab link (default CSO behavior; see later)

Those assumptions might not be true anytime. In our example, none of them is true:

  • we are using ge-0/0/10 as wan link
  • there is no dhcp able to assign an address to wan links
  • ports ge-0/0/2 will be used as fab links

As a result, we need to prepare the srx device properly. We call this step “pre-staging”.

First, we zeroize the device by running:

root@srx> request system zeroize

After completing, the device will have the factory default configuration loaded.

We remove some statements that are not useful and might break the provisioning process:

delete system services dhcp-local-server
delete chassis auto-image-upgrade
delete security zones security-zone trust interfaces ge-0/0/2.0
delete interfaces ge-0/0/0 unit 0 family inet dhcp
delete interfaces ge-0/0/2
delete interfaces ge-0/0/15 unit 0 family inet dhcp
delete access

Basically we want to avoid any local dhcp related operation to create issues and we remove any reference to ge-0/0/2 so to make it available as fab port.

Moreover, we configure our wan link:

###node0
set interfaces ge-0/0/10 unit 0 family inet address 192.168.130.2/24
set routing-options static route 0/0 next-hop 192.168.130.1
set security zones security-zone trust interfaces ge-0/0/10.0
###node1
set interfaces ge-0/0/10 unit 0 family inet address 192.168.150.2/24
set routing-options static route 0/0 next-hop 192.168.150.1
set security zones security-zone trust interfaces ge-0/0/10.0

After committing, devices should be able to reach the Internet.

We can verify this on both nodes:

root> telnet redirect.juniper.net port 443 inet
Trying 44.226.57.191...
Connected to redirect.junipercloud.net.
Escape character is '^]'.
^C^C
Connection closed by foreign host.

root>

If successful, it means that both nodes can reach the redirect server and ztp process can start!

At this point, srx devices are ready.
Next step will be to move to CSO GUI and start modeling the cluster.

Ciao
IoSonoUmberto

A first high level look at CSO SDWAN solution

I’ve recently started working on a new project involving CSO: Juniper SDWAN solution.

It seems an interesting project as the solution is a mix of different topics we can find in the networking world: routing, security, automation, …

As this is the first time I’m approaching a SDWAN project, I’ve started trying to understand the overall architecture behind CSO solution.

The following image shows the main players involved:

SDWAN aims at connecting “in a smart, secure and dynamic way” different sites distributed geographically across the world.
Sites are generally divided into two categories: spokes (branches) and hubs (HQs).
At each site, CPE devices will be installed and will act as the SDWAN nodes. Those devices are (often) Juniper SRXs. Of course, according to the site, we will use different SRX models. For example, to deploy a large hub site, we will probably go with a SRX4200 while for a small hub site a SRX1500 might be enough. Similar considerations may be done for spoke sites; small sites could make use of a SRX345 while larger sites, with higher throughput requirement, might require to go with a bigger device like a SRX1500.
Juniper official documentation provides guidance to choose the right device for your sites.

As you might notice, branches connect to the HQ via multiple “links/networks” (often called wan links). This probably the key concept behind the SDWAN solution: to leverage multiple networks and be able to send traffic over the best path based on configure.
Typically, we talk about two uplinks on a CPE: MPLS and Internet, where MPLS is a Traffic-Engineered network while Internet is more of a best-effort network.
Anyhow, here, I simply wrote network1 and network2 to underline this important concept: SDWAN leverages multiple connections/networks to connect sites. Each network will have its own dynamics but I think it is important to see them just as different networks and not to stick with the common view “MPLS gold link vs Internet BE link”. Potentially, we might have more than two links. For example we might have MPLS, Internet, ADSL and LTE (SRX branch devices can be equipped with cards to support access technologies like ADSL and LTE).

What’s the expected result? Suppose we want to guarantee some SLAs to video streaming applications. With CSO, we will be able to configure that SLA policy. Once configured, the SRXs will use active and passive probing techniques (I will talk about them in future posts) over the two links in order to understand which link better satisfies the SLA. This path monitoring/probing will be continuous; this means that,at time 0, video streaming traffic might be sent over the wan0 link but, at time 1, SRX realized wan1 link performs better and traffic will be switched to this link.

I will analyze those aspects in future posts. This time I want to focus on getting a high level idea of the overall architecture.

We still miss two elements from the image above: redirect server and CSO.

Redirect server is used during the ZTP process. Once we connect a CPE to the network and boot it, it will start the phone-client and will contact the phone-home server (redirect server). The CPE will provide its serial number and, based on that information, the redirect server will tell the CPE how to reach the CSO instance in order to proceed with the ZTP process. The redirect server is owned by Juniper and hosted on the Internet. This means that the CPE must be able to reach the Internet. How this is achieved is beyond CSO SDWAN; the underlying service provider network must provide this connectivity, somehow. It might be directly assigning a public address to the CPE interface or assigning a private one and having a NAT device (owned and controlled by the SP) between the CPE and the internet. In any case, as said, this is something the SP network has to provide. SDWAN CPE devices simply expect that connectivity to be available when SRX is turned on and interface connected to the network.

Last, we have the CSO object. Actually, that is a collection of objects: OAM hubs, vRRs and CSO software servers.
OAM hubs are used to terminate IPSEC tunnels between CPEs and CSO. This way we secure OAM traffic. This becomes extremely important when the CSO instance is not installed on-premise; in that case, we need to go through the internet which is, by definition, a non secure network. Here, we are assuming the CSO internet is hosted on the Internet. This is a real scenario provided by Juniper where CSO is offered as Cloud service.
vRRs are virtual route reflectors and will be used to distribute routing information.
The CSO servers, instead, are where the actual software is running.

Let’s start looking at how the different players interact with each other.

As mentioned before, the first step is ZTP.

The idea behind ZTP, as the name suggests, is to have a CPE provisioned without the need of human interaction. User simply connects the CPE to a network with Internet reachability and CSO will take care of everything.
Being realistic, we won’t probably have real ZTP but more a “near to ZTP”. Why? In order to have ZTP working, we need to connect a certain port to the network (that can reach internet). We need to use a specific port (check documentation to detect the port for different models) as factory default configuration enables DHCP on that port. Here might come the issue. ZTP expects the device to obtain an address via DHCP. This is reasonable as it is the natural way we can think of in order to assign an address to an interface with “zero touch”. Anyhow, it might happen that such dhcp capability is not available at a branch site. In that case, a user will have to connect to device CLI and manually configure an IP address on the required port. Similar action will be needed if we, for whatever reason, do not intend to use the expected “ztp port”. In these cases, we won’t have full ZTP…but we will be pretty close. However, full ZTP was not possible for environment limitations, not due to CSO SDWAN issues.

Going on, either via full ZTP or “near to” ZTP, the CPE will reach the redirect server that will “redirect” the CPE to its CSO instance. Once the CPE receives that information, it will get in touch with the CSO instance and CSO software will start provisioning the Junos device. Provisioning leverages outbound SSH and uses NETCONF as transport layer to carry configuration information. From now on, CSO will push control plane and data plane configuration on the CPE device.

The control plane is built between every site (spokes and hubs) and CSO.

As anticipated before, the CSO object is a combination of multiple elements. Two OAM hubs act as front door and secure access to the CSO servers and the vRRs.

OAM traffic travels between CPEs and CSO (CSO server and vRRs). As that traffic might go through a non-secure network (this is for sure the case if the cloud solution is chosen) we want to secure communications. We achieve this by building IPSEC tunnels between CPEs and OAM hubs. We talk about OAM hubs as we have 2 OAM hubs for redundancy.
Inside those tunnels we will have BGP traffic (oruting control plane) and NETCONF traffic (configuration control plane).

By default, OAM traffic must be enabled on the Internet link of the CPE. Anyhow, if other links are able to reach the Internet, nothing prevents us from enabling OAM traffic on those links as well.

For example, in the image above, both network1 and network2 are able to reach the internet so we enable OAM on both wan0 and wan1. As a result we will have a total of 4 IPSEC tunnels between a site and OAM hubs:

  • wan0 to OAM hub1
  • wan0 to OAM hub2
  • wan1 to OAM hub1
  • wan1 to OAM hub2

If network2 did not have internet reachability, then we would have OAM traffic enabled only on wan0, leading to only two IPSEC tunnels being established. We would still have redundancy as we would connect to two OAM hubs.

An exception must be considered is we are going to deploy a cluster. I’m not going into the details of how clusters work in CSO but just highlight some key concepts. I also assume some previous SRC clustering knowledge. With clusters, wan links are distributed across nodes. For instance, we might have:

  • wan0 (reth0) on node0
  • wan1 (reth1) on node1

Here, reth interfaces, unlike standard configuration, only has a single memeber.
Assume wan0 is an internet links and wan1 a mpls link. Normally, we might enable OAM on wan0 only. Anyhow, with clusters, CSO requires both nodes of a cluster to have OAM reachability. As a consequence, OAM must be enabled on both wan links which means that both networks behind those links must be able to reach the internet. Actually, that is a strict requirement from a CSO configuration point of view. Let me clarify. With clusters, CSO needs that both wan links (each of them belonging to a different cluster node) are enabled for OAM traffic. We do that to avoid CSO errors. Among our networks, only network1 has internet access. This means that only 2 out of 4 tunnels towards OAM hubs will be up (the ones through wan0) and it also means that, as soon as node0 goes down, site will lose OAM connectivity. We are free to pursue this path (maybe because we really cannot connect network2 to the internet, but we must know that it will be normal to have some OAM tunnels down and be aware of the risks and downsides.

I’m going to conclude this post with a quick look at the dataplane:

CSO will configure devices so to create a typical hub&spoke topology. It will achieve so by creating an overlay of IPSEC tunnels. Each CPE will have an IPSEC tunnel to the hub for each wan link.
Again, from a CSO SDWAN perspective, only the overlay matters. The underlay must be preconfigured so to provide IP reachability between sites.
The, CSO will also create GRE tunnels between sites and configure VRFs. As a result, the dataplane will be MPLSoGREoIPSEC.
Routes inside VRFs are installed based on BGP advertisements received from vRRs via OAM tunnels (control plane).

It is also possible to have direct spoke-to-spoke tunnels. Those tunnels are created on-demand when certain configurable thresholds are crossed. I will talk about this in future posts, especially as this feature brings into play some interesting design choices made to support “CPE behind NAT” use-case.

That’s it for today!
Ciao
IoSonoUmberto

Running iBGP sessions inside IPSEC tunnels with SRXs

TO secure traffic between SRX devices we will likely build site-to-site route-based IPSEC VPNs.

Once up and running, an IPSEC tunnel is nothing more than a tube carrying traffic. This means we can have a BGP session running inside the tunnel,

It is useful to look at this use-case as it represents one of the many building blocks of the SD-WAN solution. Here, we do not aim at replicating the same exact scenario we have with SD-WAN. The goal is to provide an example showing how an overlay IPSEC tunnel can transport bgp packets so that the bgp session will be totally transparent to the underlay.

Let’s consider the following image:

We have two vsrxs that will establish an ipsec tunnel with a third vsrx called oam. Inside those tunnel we will make bgp sessions flow.

From a bgp perspective, vsrx oam will act as route reflector for vpn routes while vsrxs east and west will be the clients.

As you can see, vsrxs can talk to each other through a service provider network. To us, that network is transparent. The SP network might provide an IP transport, a MPLS transport or something else. However, that is not relevant from a vsrx perspective. The only thing we do care about here is that the SP network allow srxs to reach the interfaces acting as ipsec tunnel endpoints on the other vsrxs (ge* interfaces in the image above).

From a bgp perspective, vsrxs east and west are directly connected to vsrx oam via point to point links. These p2p links are logical links; actually, they are ipsec tunnels. This is why we say ipsec tunnels form the overlay network, built upon the underlay one (the SP network). SP network provides connectivity and allows the ovrlay to be built, overlay brings the services.

All the vsrxs have a 0/0 route pointing to the SP network. From there, to us, it is a blackbox. We assume the SP network grants us all the communications we need.

Let’s start building with same baseline configuration.

We look at vsrx east. Configuration for other vsrx can be deducted easily.

First, we configure core facing interface:

set interfaces ge-0/0/1 unit 0 family inet address 173.30.2.0/31

We place that interface into a zone:

set security zones security-zone bb host-inbound-traffic system-services all
set security zones security-zone bb host-inbound-traffic protocols all
set security zones security-zone bb interfaces ge-0/0/1.0

We also configure the loopback (ibgp session will be loopback based):

set interfaces lo0 unit 0 family inet address 1.1.1.1/32

Next, we build IKE proposal and policy:

set security ike proposal ike-prop authentication-method pre-shared-keys
set security ike proposal ike-prop dh-group group14
set security ike proposal ike-prop authentication-algorithm sha-384
set security ike proposal ike-prop encryption-algorithm aes-256-cbc
set security ike policy ike-pol mode main
set security ike policy ike-pol proposals ike-prop
set security ike policy ike-pol pre-shared-key ascii-text "$9$T3CuREyKvLRheW8Xws5QFntOMWxwYohS7V"

There, we simply configured algorithms and keys.

Next, we create the ike gateway:

set security ike gateway oam-gw ike-policy ike-pol
set security ike gateway oam-gw address 173.30.6.0
set security ike gateway oam-gw dead-peer-detection
set security ike gateway oam-gw external-interface ge-0/0/1.0
set security ike gateway oam-gw version v2-only
  • ike v2 is used
  • DPD will allow use to detect failures to reach remote peer
  • address is the IP of the oam vsrx (the one the SP network must be able to reach)
  • external interface is the core facing one

Next, we move to ipsec configuration.

Proposal and policy:

set security ipsec proposal ips-prop protocol esp
set security ipsec proposal ips-prop authentication-algorithm hmac-sha-256-128
set security ipsec proposal ips-prop encryption-algorithm aes-256-cbc
set security ipsec policy ips-pol proposals ips-prop

Similarly to what we did with IKE, we configure algorithms to be used.

Last, we define the VPN:

set security ipsec vpn oam bind-interface st0.0
set security ipsec vpn oam ike gateway oam-gw
set security ipsec vpn oam ike ipsec-policy ips-pol
set security ipsec vpn oam establish-tunnels immediately

As this is a route-based vpn, we bind it to a secure tunnel (st0) logical unit. We also reference the ike gateway (so that the vpn knows where to terminate the tunnel) and the ipsec policy (so that the vpn knows which algorithms to use). Moreover, we tell Junos to establish the tunnels immediately (another options is to bring up the tunnel only when traffic that needs to cross it arrives).

We configure the st0.0 interface:

set interfaces st0 unit 0 family inet mtu 1436
set interfaces st0 unit 0 family inet address 10.0.1.2/30

In this case, st0.0 on oam vsrx is assigned IP 10.0.1.1.

The tunnel interface must belong to a zone. Here, we configure its own zone for st0.0:

set security zones security-zone vpn-oam host-inbound-traffic system-services all
set security zones security-zone vpn-oam host-inbound-traffic protocols bgp
set security zones security-zone vpn-oam interfaces st0.0

We verify tunnels are up. Here, we check on oam to see tunnels towards both vsrxs (east and west):

root@oam> show security ike security-associations
Index   State  Initiator cookie  Responder cookie  Mode           Remote Address
5264574 UP     09f2941f0fe04076  54480e7648780965  IKEv2          173.30.5.0
5264575 UP     c167f1caa638c5ff  0c746e442317f3f5  IKEv2          173.30.2.0

root@oam> show security ipsec security-associations
  Total active tunnels: 2     Total Ipsec sas: 2
  ID    Algorithm       SPI      Life:sec/kb  Mon lsys Port  Gateway
  <131073 ESP:aes-cbc-256/sha256 cf36c4ea 998/ unlim - root 500 173.30.2.0
  >131073 ESP:aes-cbc-256/sha256 e5d4d9f7 998/ unlim - root 500 173.30.2.0
  <131074 ESP:aes-cbc-256/sha256 293f5dc7 3374/ unlim - root 500 173.30.5.0
  >131074 ESP:aes-cbc-256/sha256 12a3c7dd 3374/ unlim - root 500 173.30.5.0

Tunnels are up!

Now we want to build the iBGP session traveling inside the tunnel.

Again, we look at vsrx east.

First, we configure the AS (same on all the vsrxs as we configure iBGP):

set routing-options autonomous-system 100

Next, we tell the vsrx to reach the bgp neighbor through the ipsec tunnel:

set routing-options static route 3.3.3.3/32 next-hop st0.0

Check RIB is updated:

root@east> show route 3.3.3.3

inet.0: 21 destinations, 21 routes (21 active, 0 holddown, 0 hidden)
+ = Active Route, - = Last Active, * = Both

3.3.3.3/32         *[Static/5] 00:59:00
                    >  via st0.0

We configure the iBGP group:

set protocols bgp group i type internal
set protocols bgp group i local-address 1.1.1.1
set protocols bgp group i family inet-vpn unicast
set protocols bgp group i neighbor 3.3.3.3

On the oam vsrx we have a RR-BGP configuration:

set protocols bgp group i type internal
set protocols bgp group i local-address 3.3.3.3
set protocols bgp group i family inet-vpn unicast
set protocols bgp group i cluster 0.0.0.1
set protocols bgp group i neighbor 1.1.1.1
set protocols bgp group i neighbor 2.2.2.2

As the iBGP sessions are loopback-based the lo0 interface will be involved. That interface must belong to a zone as well. Again, we configure lo0 in its own zone:

set security zones security-zone lo0 interfaces lo0.0 host-inbound-traffic system-services all
set security zones security-zone lo0 interfaces lo0.0 host-inbound-traffic protocols all

If we commit now, BGP will not come up. This is becuase bgp traffic is source from lo0 and leaves the router through another interface. As the vSRX is a firewall and two interfaces are involved, we need a security policy to allow this kind of traffic.

The following policy is configured on all the vsrxs (adjust zone names as needed):

set security policies from-zone vpn-oam to-zone lo0 policy allow match source-address any
set security policies from-zone vpn-oam to-zone lo0 policy allow match destination-address any
set security policies from-zone vpn-oam to-zone lo0 policy allow match application junos-bgp
set security policies from-zone vpn-oam to-zone lo0 policy allow then permit

This policy allows bgp traffic coming from the st0.0 interface (zone vpn-oam) to be sent to lo0.0 (zone lo0). As the policy is “from st0.0 to lo0.0”, it will allow bgp packets (dst port 179) coming from the neighbor.

Now, everything should be ok and bgp should be up. Again, we check on vsrx oam to see sessions are up to both east and west:

root@oam> show bgp summary
Threading mode: BGP I/O
Groups: 1 Peers: 2 Down peers: 0
Table          Tot Paths  Act Paths Suppressed    History Damp State    Pending
inet.0
                       0          0          0          0          0          0
bgp.l3vpn.0
                       0          0          0          0          0          0
Peer                     AS      InPkt     OutPkt    OutQ   Flaps Last Up/Dwn State|#Active/Received/Accepted/Damped...
1.1.1.1                 100        128        126       0       1       56:36 Establ
  bgp.l3vpn.0: 0/0/0/0
2.2.2.2                 100        132        130       0       0       58:17 Establ
  bgp.l3vpn.0: 0/0/0/0

There it is! “BGPoverIPSEC”!

Few words about the oam vsrx. There, we have two tunnels. Let’s briefly see how this is achieved.

First, we need two logical tunnel interfaces:

set interfaces st0 unit 0 family inet mtu 1436
set interfaces st0 unit 0 family inet address 10.0.1.1/30
set interfaces st0 unit 1 family inet mtu 1436
set interfaces st0 unit 1 family inet address 10.0.1.5/30

We use a single zone for both tunnel interfaces:

set security zones security-zone vpn-oam host-inbound-traffic system-services all
set security zones security-zone vpn-oam host-inbound-traffic protocols bgp
set security zones security-zone vpn-oam interfaces st0.0
set security zones security-zone vpn-oam interfaces st0.1

We have 2 ike gateways, one per vpn/ipsec tunnel:

set security ike gateway east-gw ike-policy ike-pol
set security ike gateway east-gw address 173.30.2.0
set security ike gateway east-gw dead-peer-detection
set security ike gateway east-gw external-interface ge-0/0/0.0
set security ike gateway east-gw version v2-only
set security ike gateway west-gw ike-policy ike-pol
set security ike gateway west-gw address 173.30.5.0
set security ike gateway west-gw dead-peer-detection
set security ike gateway west-gw external-interface ge-0/0/0.0
set security ike gateway west-gw version v2-only

The two gateways differ in terms of endpoint address. Anyhow, they both rely on the same ike-policy. This is not mandatory; we might have per ike-gateway ike-policies. Anyhow, here, it was simpler to have a single ike-policy (referencing a single ike-proposal) and re-use multiple times.

Something similar is seen when we look at the actual vpn definitions:

set security ipsec vpn east bind-interface st0.0
set security ipsec vpn east ike gateway east-gw
set security ipsec vpn east ike ipsec-policy ips-pol
set security ipsec vpn east establish-tunnels immediately
set security ipsec vpn ewst bind-interface st0.1
set security ipsec vpn ewst ike gateway west-gw
set security ipsec vpn ewst ike ipsec-policy ips-pol
set security ipsec vpn ewst establish-tunnels immediately

They both use the same ipsec policy but have, obviously, different bind interfaces and ike gateways.

We now have our BGP control plane built over an IPSEC overlay network.

Ciao
IoSonoUmberto

Isolating different deployments with Contrail Security

In this previous post we introduced Contrail Security and showed how to configure tags and policies.
This time we are going to focus on a new use-case.
Companies do not have one copy of an application but they have multiple copies. One might be the lab application used to test new features or new software versions while the other might be the production one, the one serving actual customer requests.
It is not common but let’s assume they run within the same datacenter.
We might group VMs by deployment type: lab or production.
Deployment is nothing more than another contrail security tag type!
This is our reference topology:
topo
As you can see, our iosonoweb application actually includes 2 “copies” of the application: one for lab purposes and one for deployment use.
At the same time, we still have just 3 virtual networks.
The client can connect to both ws VMs:

$ hostname
sec-cli
$ ssh cirros@192.168.1.4
cirros@192.168.1.4's password:
$ hostname
sec-ws
$ exit
$ ssh cirros@192.168.1.6
cirros@192.168.1.6's password:
$ hostname
sec-ws-2
$ exit
$

This also means that, by default, VM sec-ws can talk to both sec-app and sec-app-2.
This is confirmed here:

$ hostname
sec-ws
$ ssh cirros@192.168.2.5
cirros@192.168.2.5's password:
$ hostname
sec-app
$ exit$
$ ssh cirros@192.168.2.6
cirros@192.168.2.6's password:
$ hostname
sec-app-2
$ exit
$

This full reachability might be ok but best practice would say it is better to have isolation between different deployments.
This is the expected behavior:
topo_rules
We want our lab and production deployments not being able to talk to each other!
Here we will only focus on the interaction between tier=frontend and tier=logic. Replicating the same schema between logic and db will simply be a copy of what we are going to do here!
We will focus on the following 5 VMs:
vms
Contrail security can solve this problem pretty easily by leveraging the new deployment tag we introduced before.
As described in the first use-case, we apply appropriate tags to VMIs; this time we also set the deployment tag:
vmi_tags
At the end, all VMIs should be tagged:
tags
Tag tier=db is empty because, as said before, we focus on the frontend-logic dialogue.
Here, we do not want to allow only specific services; we simply want to block communications between deployments but, within the same deployment (e.g. sec-ws sec-app), all kind of traffic should be permitted.
For this reason, I create a “permit-all” service group:
svc_group_any
Next, we build an application policy for application=iosonoweb. Inside this policy we configure one firewall policy with two rules:
rules
First rule allows traffic from VN sec_ac to tier frontend; this basically allows the client to connect to both ws VMs.
Second rule instead, allows traffic between tiers frontend and logic only if involved objects have matching deployment tag. This new match condition is the key to support this use-case. A frontend+lab VMI will be able to talk to a logic+lab VMI as they share the same deployment tag (lab) but that same frontend+lab VMI won’t be able to talk to a logic+production VMI as deployment tag is different.
Now time to verify things are working.
Check client can still connect to both sec-ws VMS:

$ hostname
sec-cli
$ ssh cirros@192.168.1.4
cirros@192.168.1.4's password:
$ hostname
sec-ws
$ exit$
$ ssh cirros@192.168.1.6
cirros@192.168.1.6's password:
$ hostname
sec-ws-2
$ exit
$

Then try to connect from sec-ws to both sec-app VMs:

$ hostname
sec-ws
$ ssh cirros@192.168.2.5
cirros@192.168.2.5's password:
$ hostname
sec-app
$ exit
$ ssh cirros@192.168.2.6
^C
$

As expected, ssh session towards deployment sec-app fails.
This can be seen by checking flows inside contrail vrouter agent.
For lab-to-lab SSH session, we have action forward:

-----------------------------------------------------------------------------------
   203844471228       192.168.2.5:22                                      6 (13)
                         192.168.2.3:56156
(Gen: 1, K(nh):163, Action:F, Flags:, TCP:SSrEEr, QOS:-1, S(nh):163,  Stats:20/3306,
 SPort 51080, TTL 0, Sinfo 22.0.0.0)
   471228203844       192.168.2.3:56156                                   6 (13)
                         192.168.2.5:22
(Gen: 1, K(nh):148, Action:F, Flags:, TCP:SSrEEr, QOS:-1, S(nh):148,  Stats:32/4114,
 SPort 65264, TTL 0, Sinfo 21.0.0.0)

For lab-to-production SSH session action is discard due to FWpolicy:

-----------------------------------------------------------------------------------
   104608305764       192.168.2.3:37568                                   6 (13)
                         192.168.2.6:22
(Gen: 1, K(nh):148, Action:D(FwPolicy), Flags:, TCP:S, QOS:-1, S(nh):148,
 Stats:2/148,  SPort 50887, TTL 0, Sinfo 21.0.0.0)
   305764104608       192.168.2.6:22                                      6 (13)
                         192.168.2.3:37568
(Gen: 1, K(nh):148, Action:D(Unknown), Flags:, TCP:Sr, QOS:-1, S(nh):21,
 Stats:0/0,  SPort 55353, TTL 0, Sinfo 0.0.0.0)

Contrail security worked just fine!
This example showed how Contrail can provide, let’s say “micro-segmented” security. We were able to enforce security between VM attached to the same VN. Even if VMs shared the same broadcast domain, some sort of communications (inter-deployments) are denied and blocked!
Same happens if we try to SSH from the deployment sec-ws VM. This time the failed SSH session is towards lab sec-app VM.
Contrail GUI nicely represent these interactions:
graphic_map
The outermost circle represents the deployment while the innermost the tier.
Allowed communications (light blue) are the ones within the same deployment. Communications trying to go from a deployment to another are denied (orange).
That’s it for today
Ciao
IoSonoUmberto

My first Contrail Security policy

Security must be everywhere, we cannot trust anyone…zero trust!
Even inside the DC we are not safe and have to control traffic flowing between our workflows.
Normally, we would deploy a FW VM between VMs that need security enforcement. This requires a new VM to be created, meaning resources will be taken out of our cloud. So what if the SDN controller itself was able to provide security enforcement?
Contrail faces this problem by providing flexible and “abstract” firewall-like policies. By “abstract” we mean policies are not bounded to specific VM names or IP addresses but make use of some generic names that help making the policies re-usable.
Slow down! We said Contrail Security is a valid alternative to deploying multiple dedicated FW VMs. That is true but, remember, the FW VM still provides more advanced security features. Contrail security is perfect to control traffic between workloads by means of “standard” policies where I allow/block traffic based on protocol, ports, etc… Anyhow, if more sophisticated solutions like antivirus, web filtering, IPS and so on are needed, then go with a complete security virtual appliance like Juniper vSRX.
Back to Contrail Security.
They key here is an object called “tag”. Tags are used to characterize a Contrail object; in the end, that’s what tags do. Tags bring information like site, the tier, the deployment or application.
Many Contrail objects can be tagged: VMIs, networks, floating IPs, etc…
Policies are built upon those tags; for example, we can have a rule saying “block tcp port 22 traffic between tier=java and tier=db”.
As you might see, there are no IP addresses, no VM names. As a consequence, the policy might be easily re-used “as-is” in order to control traffic flowing between different set of workflows using the same tags.
Enough with the theory…let’s configure tags. Contrail has a dedicated tags tab; for each tag we specify the name and its type (tier, application, etc…)
tags
Now it is time to control traffic between 2 VMs.
I built the following topology:
topo
We have 4 VMs: one acting as a client and 3, combined together, create an app called iosonoweb.
For this reason, those 3 vms share the same application tag: iosonoweb.
Inside the application, each VM has its own role. This role is reflected by the tier tag: web-server, logic, database.
Then, we have 3 virtual networks connecting the different VMs of our setup.
This is everything we need to implement contrail security policies.
For this first use-case, we will only focus on the client-webserver dialogue. This means that involved objects will be the client VM, the web server VM and the virtual network connecting them.
We created tags before; now we need to tag our objects. In this first use-case we simply need to tag the sec-ws VMI attached to the sec_ac VN. This is done by editing the VMI object where we have a dedicated tags tab:
vmi_tagged
Here we say VMI belongs to application iosonoweb and tier frontend.
Similarly, we can tag all the other objects; for example, sec-app VM VMIs will be tagged with application=iosonoweb and tier=logic.
At the moment it is not possible to tag a VM but only VMIs. This means that “tagging a VM with tier=X actually means tagging all its VMIs with tier=X”.
Back to configuration!
Let’s briefly see how contrail security objects works and are interconnected.
We tagged three VMs with application=iosonoweb. The “outermost” security object is the application policy. Application policy is mapped to an application tag.
This object will include one or more firewall policy which in turn will contain one or more firewall rules. Firewall rules are the actual object where security is enforced. They are standard firewall policy rules: they say things like “block TCP port 22 between A and B in both directions”.
The idea is to have the application policy including all the firewall policies and rules controlling all the different interactions that can take place inside our app. For example, we can have policies and rules to control traffic between sec-cli and sec-ws (this usecase), others for traffic between tier=frontend and tier=logic and so on.
First, we are going to configure Service Groups. Service Groups are nothing more than a set of applications (layer 4 applications):
service_groups
In this example we created two groups: first one includes TCP:22 (SSH) and TCP:80 (HTTP) while second group contains TCP:21 (ftp).
Next, we configure the firewall policy:
fw_policy
When creating the policy, the wizard allows us to define firewall rules. I created 2 firewall rules. Let’s see them:
fw_rule
First rule denies ftp (service group cli-access-ko, see above) between network sec_ac and and object tagged with tier=frontend. This means blocking for example a ftp session from VM client (that traffic will travel over sec_ac VN) towards the web-service VM (whose vmi is tagged with tier=frontend).
Finally, we apply the firewall policy to the application by creating an Application policy:
application_policy
Policy is called iosonoweb and simply references the firewall policy created before. This application policy is mapped to our application by means of tag application=iosonoweb (that we created before and mapped to the web-server VMI).
We are ready! Traffic between sec-cli VM and sec-ws VM is “controlled” by Contrail Security firewall policies.
Now let’s enter the sec-cli VM:

$ ifconfig eth0 | grep "inet "
          inet addr:192.168.1.3  Bcast:192.168.1.255  Mask:255.255.255.0

Verify SSH is working:

$ ssh cirros@192.168.1.4

Host '192.168.1.4' is not in the trusted hosts file.
(ecdsa-sha2-nistp521 fingerprint md5 11:36:26:a6:ad:3c:13:4d:a3:75:b6:13:3c:87:03:1f)
Do you want to continue connecting? (y/n) n

ssh: Connection to cirros@192.168.1.4:22 exited: Didn't validate host key

Verify HTTP is working:

$ curl 192.168.1.4
curl: (7) Failed to connect to 192.168.1.4 port 80: Connection refused

We get a connection refused reply as sec-ws VM does not have port 80 open; anyhow, the fact we got a reply means the HTTP connection passed through and was permitted by the firewall policy
Last, we try ftp:

$ telnet 192.168.1.4 21
^C
$

We never get a reply (not even a connection refused) telling us the traffic did not pass through…Contrail Security in action!
On the compute node where VM is running, we access the vrouter agent container (docker exec -it bash) and check flows.
In case of SSH session is established:

    Index                Source:Port/Destination:Port                      Proto(V)
-----------------------------------------------------------------------------------
    1225269136        192.168.1.4:22                                      6 (12)
                         192.168.1.3:54238
(Gen: 1, K(nh):141, Action:F, Flags:, TCP:SSrEEr, QOS:-1, S(nh):141,  Stats:4/1226,
 SPort 61841, TTL 0, Sinfo 20.0.0.0)

    6913612252        192.168.1.3:54238                                   6 (12)
                         192.168.1.4:22
(Gen: 1, K(nh):97, Action:F, Flags:, TCP:SSrEEr, QOS:-1, S(nh):97,  Stats:6/1086,
 SPort 61109, TTL 0, Sinfo 19.0.0.0)

Instead, with FTP:

    Index                Source:Port/Destination:Port                      Proto(V)
-----------------------------------------------------------------------------------
   362496482284       192.168.1.3:51312                                   6 (12)
                         192.168.1.4:21
(Gen: 1, K(nh):97, Action:D(OutFwPolicy), Flags:, TCP:S, QOS:-1, S(nh):97,
 Stats:3/222,  SPort 51419, TTL 0, Sinfo 19.0.0.0)

   482284362496       192.168.1.4:21                                      6 (12)
                         192.168.1.3:51312
(Gen: 1, K(nh):141, Action:D(Unknown), Flags:, TCP:Sr, QOS:-1, S(nh):141,
 Stats:0/0,  SPort 59109, TTL 0, Sinfo 0.0.0.0)

Flows from sec-cli to sec-ws has action discard (D); moreover it tells us “OutFwPolicy”…Contrail Security in action!
Reverse flow is created but action is unknown; no packets has been seen there.
Let’s try telnet:

    Index                Source:Port/Destination:Port                      Proto(V)
-----------------------------------------------------------------------------------
   358232418120       192.168.1.3:38018                                   6 (12)
                         192.168.1.4:23
(Gen: 1, K(nh):97, Action:D(OutFwPolicy), Flags:, TCP:S, QOS:-1, S(nh):97,
 Stats:2/148,  SPort 51632, TTL 0, Sinfo 19.0.0.0)

   418120358232       192.168.1.4:23                                      6 (12)
                         192.168.1.3:38018
(Gen: 1, K(nh):141, Action:D(Unknown), Flags:, TCP:Sr, QOS:-1, S(nh):141,
 Stats:0/0,  SPort 59168, TTL 0, Sinfo 0.0.0.0)

Ops! Same result; contrail security blocked us.
This tells us how security policies work: there is an implicit “deny all”!
Same happens for ICMP:

$ ping 192.168.1.4
PING 192.168.1.4 (192.168.1.4): 56 data bytes
^C
--- 192.168.1.4 ping statistics ---
3 packets transmitted, 0 packets received, 100% packet loss

And UDP as well:

$ nslookup google.it 192.168.1.4
Server:    192.168.1.4
Address 1: 192.168.1.4

^C
$

Flow is blocked:

    Index                Source:Port/Destination:Port                      Proto(V)
-----------------------------------------------------------------------------------
   101136316704       192.168.1.4:53                                     17 (12)
                         192.168.1.3:50157
(Gen: 1, K(nh):141, Action:D(Unknown), Flags:, QOS:-1, S(nh):141,  Stats:0/0,
 SPort 49389, TTL 0, Sinfo 0.0.0.0)

   316704101136       192.168.1.3:50157                                  17 (12)
                         192.168.1.4:53
(Gen: 1, K(nh):97, Action:D(OutFwPolicy), Flags:, QOS:-1, S(nh):97,  Stats:1/84,
 SPort 58224, TTL 0, Sinfo 19.0.0.0)

Let’s add a new policy to our application policy
We add a new firewall policy to our application policy:
insert_new_policy
Firewall policy has 3 rules, allowing all tcp, udp and icmp traffic:
permit_all
Finally, we check our application policy has 2 firewall policies applied:
two_policies_applied
Let’s check UDP:

$ nslookup google.it 192.168.1.4
Server:    192.168.1.4
Address 1: 192.168.1.4

nslookup: can't resolve 'google.it'

VM sec-ws is not a DNS server but this time we get a reply.
Flow confirms this:

   450864512628       192.168.1.4:53                                     17 (12)
                         192.168.1.3:33888
(Gen: 1, K(nh):141, Action:F, Flags:, QOS:-1, S(nh):141,  Stats:1/97,
 SPort 59472, TTL 0, Sinfo 20.0.0.0)

   512628450864       192.168.1.3:33888                                  17 (12)
                         192.168.1.4:53
(Gen: 1, K(nh):97, Action:F, Flags:, QOS:-1, S(nh):97,  Stats:1/69,  SPort 56410,
 TTL 0, Sinfo 19.0.0.0)

Action is Forward!
Same for telnet and ping:

$ ping 192.168.1.4
PING 192.168.1.4 (192.168.1.4): 56 data bytes
64 bytes from 192.168.1.4: seq=0 ttl=64 time=0.914 ms
64 bytes from 192.168.1.4: seq=1 ttl=64 time=0.254 ms
^C
--- 192.168.1.4 ping statistics ---
2 packets transmitted, 2 packets received, 0% packet loss
round-trip min/avg/max = 0.254/0.584/0.914 ms
$ telnet 192.168.1.4
telnet: can't connect to remote host (192.168.1.4): Connection refused

This tells us something about design considerations.
With the permit-all policy, the rule allowing SSH and HTTP is not so useful anymore as traffic would match the permit-all policy. If we intend to implement a permit-all policy, then we should probably go for a blacklist approach where we have 2 firewall policies: one denying traffic, then the permit-all.
On the other hand, we have the white-list approach. Again 2 policies: one permitting traffic and a second one denying all traffic. Actually, as we saw, the deny-all policy can be omitted as it is implicit.
Choose the best approach based on your needs and so to minimize the number of rules 😊
Now we understood the phylosophy.
Next, we can create further policies to control interaction between other VMs.
Realistically, we will have firewall rules between tier=frontend and tier=logic and other firewall rules between tier=logic and tier=db.
We omit configuring those objects as, by now, we are experts!
That’s it for today
Ciao
IoSonoUmberto

Securing traffic between two containers using a cSRX in secure wire mode

In this post I introduced Juniper cSRX: a containerized SRX.
Today, I want to show a simple use-case where we use cSRX to secure traffic netween two containers.
Topology is pretty simple:
topo
I previously created an ubuntu-derived image including packages like ping, ssh, telnet,…
I create 2 containers:

docker run -d -it --privileged --network mgmt --name pippo uping
docker run -d -it --privileged --network mgmt --name alex uping

At this stage, both containers are connectef to a docker network named mgmt.
Next, I create two more networks and attach my containers to them:

docker network create trust
docker network create untrust
docker network connect trust alex
docker network connect untrust pippo

We create the cSRX:

docker run -itd --privileged --network mgmt -e CSRX_ROOT_PASSWORD="root" -e CSRX_FORWARD_MODE="wire" -e CSRX_SIZE="small" --name cane hub.juniper.net/security/csrx:18.2R1.9
docker network connect trust cane
docker network connect untrust cane

I am not going to talk about cSRX internals and interfaces; please refer to the other post for more information.
Now, topology is ready!
We inspect network trust:

[root@aio ~]# docker inspect trust | grep -B 3 MacA
            "alexfe54d142cf1ddaae84ac0df275dbd72e8752270ae1732cd7dc29": {
                "Name": "alex",
                "EndpointID": "4739e8d63c655aa52a9e0c738db3bb59576f7c4a70c1bafda505bf04a8f3f185",
                "MacAddress": "02:42:ac:13:00:03",
--
            "csrx8a8ee62a06c848e668f20cfe3332b55254aed3e5c9efa546889e": {
                "Name": "cane",
                "EndpointID": "a9113e871ab3a00180a23b3f45c53bbbf5eb5a03846564274d4fbb988f3b7fb9",
                "MacAddress": "02:42:ac:13:00:02",

As you can see, two containers are attached to it as expected.
We can do the same with untrust network:

[root@aio ~]# docker inspect untrust | grep -B 3 MacA
            "csrx26b1b47c237778a36caede3b79293d9327802a5b208a3a83d656": {
                "Name": "pippo",
                "EndpointID": "fc0504f8d6f65d3d0d883db63784e1b7415712f06f25f3e97fb7e76fe69f2817",
                "MacAddress": "02:42:ac:14:00:03",
--
            "csrx8a8ee62a06c848e668f20cfe3332b55254aed3e5c9efa546889e": {
                "Name": "cane",
                "EndpointID": "3293b468d6600597c46547bc7ce77b2ad2758026a309df2997b939a51b45acef",
                "MacAddress": "02:42:ac:14:00:02",

Let’s try to better understand how things work!
First, check linux bridges as each docker network as a bridge associated to it:

[root@aio ~]# brctl show
bridge name             bridge id               STP enabled     interfaces
br-0eb8f98b94c6         8000.024269f601f0       no              veth8931412
                                                                vethf318a75
br-70e799740560         8000.024290c0e032       no              veth61dcadc
                                                                vethb5a1b90
br-a729dc4941e2         8000.0242f267d3c0       no              veth8450309
                                                                vethda87649
                                                                vethe468807

We have two bridges with 2 interfaces (trust and untrust) and one bridge with 3 interfaces (mgmt).
If you want more details about bridges, veth interfaces and so on, please refer to the post linked at the beggining of the article 🙂
Let’s access the first ubuntu container and configure the second interface:

[root@aio ~]# docker exec -it alex bash
root@alex:/# route
Kernel IP routing table
Destination     Gateway         Genmask         Flags Metric Ref    Use Iface
default         172.18.0.1      0.0.0.0         UG    0      0        0 eth0
172.18.0.0      0.0.0.0         255.255.0.0     U     0      0        0 eth0
172.19.0.0      0.0.0.0         255.255.0.0     U     0      0        0 eth1
root@alex:/# ifconfig eth1 192.168.1.2 netmask 255.255.255.0
root@alex:/# ifconfig eth1
eth1: flags=4163  mtu 1500
        inet 192.168.1.2  netmask 255.255.255.0  broadcast 192.168.1.255
        ether 02:42:ac:13:00:03  txqueuelen 0  (Ethernet)
        RX packets 8  bytes 648 (648.0 B)
        RX errors 0  dropped 0  overruns 0  frame 0
        TX packets 0  bytes 0 (0.0 B)
        TX errors 0  dropped 0 overruns 0  carrier 0  collisions 0
root@alex:/# route
Kernel IP routing table
Destination     Gateway         Genmask         Flags Metric Ref    Use Iface
default         172.18.0.1      0.0.0.0         UG    0      0        0 eth0
172.18.0.0      0.0.0.0         255.255.0.0     U     0      0        0 eth0
192.168.1.0     0.0.0.0         255.255.255.0   U     0      0        0 eth1
root@alex:/#

By default, eth1 was assigned an address via “docker dhcp” on subnet 172.19.0.0/16.
Here, we override it as we need the two containers to appear on as if they were on the same subnet (even if they are not). Optionally, we could have created the network by specifying a subnet but that is out of the scope of this post.
I do the same on the second ubuntu container.
After that, I have the following IPs configured on my containers:
– alex 192.168.1.2
– pippo 192.168.1.3
Why do we need to trick docker and configure addresses belonging to the same subnet even if container interfaces are attached to different networks?
We created the cSRX in secure wire mode. When configured in secure wire mode, a SRX behaves as a “bump in the wire devices”…let’s say a sort of L1 device. Two interfaces make the secure wire and the idea is pretty easy: send traffic from left to right and viceversa, no switching, no routing.
Now, i connect to the cSRX.
We do not have to configure any interface as we are in secure wire mode!
We do not even have to configure the secure wire, it is already there:

root@csrx> show security forward-options secure-wire
Secure wire                       Interface       Link   Interface       Link
csrx_sw                           ge-0/0/1        up     ge-0/0/0        up
Total secure wires: 1

We configure a security policy:

root@csrx> show configuration security policies | display set
set security policies from-zone trust to-zone untrust policy p1 match source-address any
set security policies from-zone trust to-zone untrust policy p1 match destination-address any
set security policies from-zone trust to-zone untrust policy p1 match application junos-icmp-all
set security policies from-zone trust to-zone untrust policy p1 then deny
set security policies from-zone trust to-zone untrust policy p2 match source-address any
set security policies from-zone trust to-zone untrust policy p2 match destination-address any
set security policies from-zone trust to-zone untrust policy p2 match application junos-ssh
set security policies from-zone trust to-zone untrust policy p2 match application junos-telnet
set security policies from-zone trust to-zone untrust policy p2 then permit

This policy blocks ICMP and allows telnet and SSH.
This is everything we need to start.
Now, we run some traffic from alex to pippo:

PING 192.168.1.3 (192.168.1.3) 56(84) bytes of data.
^C
--- 192.168.1.3 ping statistics ---
3 packets transmitted, 0 received, 100% packet loss, time 1999ms

root@alex:/# telnet 192.168.1.3
Trying 192.168.1.3...
^C
root@alex:/# ssh 192.168.1.3
^C
root@alex:/#

Ping gave 100% loss percentage...why? 😉
Now, let's check sessions on the cSRX:

root@csrx> show security flow session
Session ID: 251, Policy name: p2/5, Timeout: 2, Valid
  In: 192.168.1.2/41288 --> 192.168.1.3/23;tcp, Conn Tag: 0x0, If: ge-0/0/1.0, Pkts: 1, Bytes: 74,
  Out: 192.168.1.3/23 --> 192.168.1.2/41288;tcp, Conn Tag: 0x0, If: ge-0/0/0.0, Pkts: 0, Bytes: 0,

Session ID: 252, Policy name: p2/5, Timeout: 6, Valid
  In: 192.168.1.2/43970 --> 192.168.1.3/22;tcp, Conn Tag: 0x0, If: ge-0/0/1.0, Pkts: 3, Bytes: 222,
  Out: 192.168.1.3/22 --> 192.168.1.2/43970;tcp, Conn Tag: 0x0, If: ge-0/0/0.0, Pkts: 0, Bytes: 0,
Total sessions: 2

We see ssh and telnet sessions.
THose packets reached the other container. This is confirmed by a tcpdump output from pippo:

root@pippo:/# tcpdump -i eth1
tcpdump: verbose output suppressed, use -v or -vv for full protocol decode
listening on eth1, link-type EN10MB (Ethernet), capture size 262144 bytes
20:26:06.218703 IP 192.168.1.2.35610 > 192.168.1.3.telnet: Flags [S], seq 1495467255, win 29200, options [mss 1460,sackOK,TS val 643724414 ecr 0,nop,wscale 7], length 0
20:26:13.100636 IP 192.168.1.2.38324 > 192.168.1.3.ssh: Flags [S], seq 72456418, win 29200, options [mss 1460,sackOK,TS val 643731296 ecr 0,nop,wscale 7], length 0

Let's have a look at policy hit count:

root@csrx> show security policies hit-count
Logical system: root-logical-system
 Index   From zone        To zone           Name           Policy count
 1       trust            untrust           p1             3
 2       trust            untrust           p2             2

Numbers are consistent: three pings were blocked while 2 packets were allowed (ssh and telnet).
That's it! Our cSRX secured traffic between controllers.
Of course, this is just a very simple example; cSRX offers advanced security features and is able to inspect and treat traffic up to layer 7 using AppSecure suite features!
Now it is time to create a cSRX and play 🙂
Ciao
IoSonoUmberto

Create your first cSRX on Docker

At first it was a physical SRX, then the vSRX came…and now it is cSRX turn.
That “c” means container! Right, a containerized firewall.
I am not going into the details of the architecture and the internals but let’s have a quick look of how a cSRX is built:
csrx_arch
A cSRX is a self-contained container that has anything we need to bring security between our containers. It runs typical Junos daemons like mgd, utmd, etc… cSRX has a Junos cli like any other Juniper product; anyhow, it is a limited cli, meaning we do not have access to any configuration stanza. For example, cSRX does not support routing features; if routing is needed then keep going with vSRX 🙂
Actually, some basic static routing is supported but nothing “complex”. cSRX can be configured either in static mode or secure wire mode. We will talk about these two modes later in dedicated posts.
The core of a cSRX is the srxpfe process that provides the actual L4-L7 security features.
Unlike a vSRX, a cSRX can have at most 3 interfaces: management, left and right.
Let’s see how to get the cSRX image and how to create its first instance.
cSRX can run both in a standard Docker environment and in Kubernetes (or Openshift) one. Moreover, if Kubernetes (or Openshift) is used, Contrail can become part of the game inorder to provide advanced virtual networking capabilities (e.g. service chaining).
In this post we are going to look at cSRX in a standard Docker environment. We assume the reader already has a host with Docker installed.
This time we are not going to have traffic traversing the cSRX; for now, we are only interested in spawning our container and have quick look inside to understand a bit how it works.
First, login to Juniper Hub:

[root@aio ~]# docker login hub.juniper.net -u XXX -p YYY
WARNING! Using --password via the CLI is insecure. Use --password-stdin.
WARNING! Your password will be stored unencrypted in /root/.docker/config.json.
Configure a credential helper to remove this warning. See
https://docs.docker.com/engine/reference/commandline/login/#credentials-store
Login Succeeded

Once authenticated, we can check available versions:

[root@aio ~]# curl -u XXX -X GET https://hub.juniper.net/v2/security/csrx/tags/list
Enter host password for user 'JNPR-FieldUser60':
{"name":"security/csrx","tags":["18.1R1.9","18.2R1.9"]}

We decide to download cSRX 18.2R1.9 image:

[root@aio ~]# docker pull hub.juniper.net/security/csrx:18.2R1.9
18.2R1.9: Pulling from security/csrx
85b4c26ccf2d: Pull complete
0790718550d6: Pull complete
b6db0b95df01: Pull complete
d38bd98d4080: Pull complete
Digest: sha256:7ed1e673c53f8d70e9b1e816f0df54213f97a51896b405cbfc3b0d7c3aa55c68
Status: Downloaded newer image for hub.juniper.net/security/csrx:18.2R1.9

We see the image is available locally:

[root@aio ~]# docker images
REPOSITORY                      TAG                 IMAGE ID            CREATED             SIZE
hello-world                     latest              fce289e99eb9        4 months ago        1.84kB
hub.juniper.net/security/csrx   18.2R1.9            872c20d11aba        10 months ago       594MB

We create 3 docker networks:

docker network create --driver bridge mgmt
docker network create --driver bridge trust
docker network create --driver bridge untrust

These networks are now available to our containers:

[root@aio ~]# docker network ls | grep bridge
81fdf73f24f7        bridge              bridge              local
a729dc4941e2        mgmt                bridge              local
0eb8f98b94c6        trust               bridge              local
70e799740560        untrust             bridge              local

Now, we are ready to run our cSRX:

[root@aio ~]# docker run -itd --privileged --network mgmt -e CSRX_ROOT_PASSWORD="root" -e CSRX_FORWARD_MODE="wire" -e CSRX_SIZE="small" --name cane hub.juniper.net/security/csrx:18.2R1.9
f74b99eaa0478a8ee62a06c848e668f20cfe3332b55254aed3e5c9efa546889e

We run it in interactive mode (it) and detached mode (d0 at the same time. This will avoid the cSRX to exit prematurely.
We attach the container to the management network we created before.
This cSRX will be called “cane”.
Moreover, we pass the container some environment variables. In this case we tell the cSRX to run in secure-wire mode, to use “root” as root password and create a small-sized cSRX.
All the available environment variables are listed here.
cSRX is listed:

[root@aio ~]# docker ps
CONTAINER ID        IMAGE                                    COMMAND                CREATED             STATUS              PORTS               NAMES
f74b99eaa047        hub.juniper.net/security/csrx:18.2R1.9   "/etc/rc.local init"   3 seconds ago       Up 2 seconds        22/tcp, 830/tcp     cane

Notice, ports 22 (ssh) and port 830 (netconf) are open to allow inbound connections.
Next, we attach the cSRX to the other two networks:

docker network connect trust cane
docker network connect untrust cane

Please notice, the order matters! By design, eth1 (second interface) is internally mapped to ge-0/0/1 which is bound to trust zone; on the other hand, eth2 is mapped to ge-0/0/0 which is bound to untrust zone.
Docker networks are assigned a subnet (Docker chooses the subnet if not explicitly configured) and runs DHCP to assign IP addresses to containers.
Here are the IPs assigned to our container:

[root@aio ~]# docker inspect cane | grep IPAddr
            "SecondaryIPAddresses": null,
            "IPAddress": "",
                    "IPAddress": "172.18.0.2",
                    "IPAddress": "172.19.0.2",
                    "IPAddress": "172.20.0.2",

Let’s look at the host routing table:

[root@aio ~]# ip route
default via 10.49.127.254 dev eth0 proto static metric 100
172.17.0.0/16 dev docker0 proto kernel scope link src 172.17.0.1
172.18.0.0/16 dev br-a729dc4941e2 proto kernel scope link src 172.18.0.1
172.19.0.0/16 dev br-0eb8f98b94c6 proto kernel scope link src 172.19.0.1
172.20.0.0/16 dev br-70e799740560 proto kernel scope link src 172.20.0.1

Here we see the subnets associated to the docker networks. As you may notice, each subnet (which means each docker networks) is associated to a “br” device. Those devices are nothing more than well-known linux bridges:

[root@aio ~]# brctl show
bridge name     bridge id               STP enabled     interfaces
br-0eb8f98b94c6         8000.024269f601f0       no              veth8931412
br-70e799740560         8000.024290c0e032       no              vethb5a1b90
br-a729dc4941e2         8000.0242f267d3c0       no              vethe468807

Each bridge has one interface connected to it:

[root@aio ~]# ifconfig | grep veth
veth8931412: flags=4163  mtu 1500
vethb5a1b90: flags=4163  mtu 1500
vethe468807: flags=4163  mtu 1500

These veth interfaces sit on the host OS (running docker engines) and are paired with container interfaces (this is how veth interfaces work and allow communications between namespaces).
LEt’s try to better understand this.
We get docker network “trust” id:

[root@aio ~]# docker inspect trust | grep Id
        "Id": "0eb8f98b94c68e90c363aa2c6a35eb60eb3074f55c0608697704d6f4484bc9d1",

The ID starts with “0eb”. We “grep” that string over the brctl show” output:

[root@aio ~]# brctl show | grep 0eb
br-0eb8f98b94c6         8000.024269f601f0       no              veth8931412

We identified the br interface associated to the trust docker networks.
Next, we get the MAC address of the container interface attached to the trust network:

[root@aio ~]# docker inspect trust | grep Mac
                "MacAddress": "02:42:ac:13:00:02",

By identifying the bridge, we also spotted a veth interface connected to it. Let’s check the mac:

[root@aio ~]# ifconfig veth8931412 | grep ther
        ether 42:f3:26:f4:2f:b4  txqueuelen 0  (Ethernet)

Mac addresses are different! This is ok as we said veth interfaces work in pairs: one on the host OS, one inside the container.
Now, we access our container:

docker exec -it cane bash

We find ourselves inside the cSRX Linux shell.
We use ifconfig to look at mac addresses.
Let’s start with ge-0/0/1, the trust interface.
This interface is bounded to eth1 which is also bounded to tapo0:

eth1      Link encap:Ethernet  HWaddr 02:42:ac:13:00:02
tap0      Link encap:Ethernet  HWaddr 02:42:ac:13:00:02

As you may notice here we see the mac we found in the docker inspect output we saw before:

[root@aio ~]# docker inspect trust | grep Mac
                "MacAddress": "02:42:ac:13:00:02"

Similarly we can do the same for the untrust interface:

ge-0/0/0 -> eth2 -> untrust
eth2      Link encap:Ethernet  HWaddr 02:42:ac:14:00:02
tap1      Link encap:Ethernet  HWaddr 02:42:ac:14:00:02
[root@aio ~]# docker inspect untrust | grep Mac
                "MacAddress": "02:42:ac:14:00:02",

Now we have everything to better understand how veth pairs work.
Let’s start with the trust network.
First, we get the associated linux bridge:

br-0eb8f98b94c6         8000.024269f601f0       no              veth8931412

From there we extract the veth interface.
We use ip link on the host OS (where docker engine runs):

31: veth8931412@if30:  mtu 1500 qdisc noqueue master br-0eb8f98b94c6 state UP mode DEFAULT
    link/ether 42:f3:26:f4:2f:b4 brd ff:ff:ff:ff:ff:ff link-netnsid 0

As you can see that veth interface is paired with “if30” and has index 31.
We move inside the cSRX and do the same:

30: eth1@if31:  mtu 1500 qdisc noqueue state UP mode DEFAULT group default
    link/ether 02:42:ac:13:00:02 brd ff:ff:ff:ff:ff:ff

Here we see interface with index 30 is paired with “if31”. This is the pair!
Rememeber, eth1 is mapped to ge-0/0/1 which is the trust interface and we started by looking at the linux bridge associated to the trust docker network…everything is consistent and connected as expected!
We told docker uses dhcp over its networks. Anyhow, we see this:

root@f74b99eaa047:/# ifconfig eth0 | grep inet
          inet addr:172.18.0.2  Bcast:172.18.255.255  Mask:255.255.0.0
root@f74b99eaa047:/# ifconfig eth1 | grep inet
root@f74b99eaa047:/# ifconfig eth2 | grep inet
root@f74b99eaa047:/# ifconfig | grep "inet a"
          inet addr:172.18.0.2  Bcast:172.18.255.255  Mask:255.255.0.0
          inet addr:127.0.0.1  Mask:255.0.0.0

Only eth0, the management interface, has an IP address (along with the loopback). This happens because the cSRX is configured this way; interfaces eth1 and eth2 are intentionally left without an IP address.
From the host os we can ssh into the cSRX over the docker management network:

[root@aio ~]# ssh root@172.18.0.2
The authenticity of host '172.18.0.2 (172.18.0.2)' can't be established.
ECDSA key fingerprint is SHA256:bsU4x9XG1NKS10dA1lWLNgPiUdWs5p+vyMEqgIQJrYM.
ECDSA key fingerprint is MD5:55:56:16:d4:02:e0:7e:af:66:ca:a0:ed:9f:24:17:61.
Are you sure you want to continue connecting (yes/no)? yes
Warning: Permanently added '172.18.0.2' (ECDSA) to the list of known hosts.
root@172.18.0.2's password:
Last login: Wed Mar 15 03:28:52 2017 from 172.17.0.1
root@f74b99eaa047%cli
root@f74b99eaa047>

And here we are, the cSRX Junos CLI!
We check interfaces:

root@csrx> show interfaces
Physical interface: ge-0/0/1, Enabled, Physical link is Up
  Interface index: 100
  Link-level type: Ethernet, MTU: 9192
  Current address: 02:42:ac:13:00:02, Hardware address: 02:42:ac:13:00:02

Physical interface: ge-0/0/0, Enabled, Physical link is Up
  Interface index: 200
  Link-level type: Ethernet, MTU: 9192
  Current address: 02:42:ac:14:00:02, Hardware address: 02:42:ac:14:00:02

We successfully created our first cSRX!
Next time we will see how to unleash its firewall capabilities 🙂
Ciao
IoSonoUmberto

Juniper SRX as a Secure home CPE

What does a simple home CPE do? Simply put, it collects traffic from several home devices and allows them to reach the Internet!

Let’s make an example. I have a PC, a printer and a Smart TV that need to reach the Internet. They will send traffic to the SRX which, in turn, will route that traffic towards the Internet.

In doing so, the SRX will perform different actions.

My home devices represent my local private LAN. Those devices will be part of a private subnet and will require an IP address on that network. For this reason, the SRX CPE will act as a DHCP server for those devices.

At the same time my SRX will act as the LAN gateway. Devices will learn this through DHCP as well. The SRX will be configured so that, when sending DHCP packets to my home devices, it will use DHCP options to specify the gateway of the LAN. My home devices will read that DHCP option and, as a reaction, will install a default route using the LAN gateway (my SRX) as next-hop.

As explained few lines above, my home devices will have private IP address. As private IP address cannot travel through the public Internet, I need someone performing NAT. It is the SRX to perform NAT when sending packets from the LAN to the Internet.

This image sums up the test topology:

switch

  • here, we assume we have a switch between home devices and the SRX. This swtch simply “aggregates” traffic from different devices and sends it to the SRX. We omit switch configuration but it is nothing more than configuring a vlan and assign interfaces (all access mode is ok:))
  • the LAN facing interface of the SRX will be configured with the LAN gateway IP address. In this example, that interface is a L3 interface
  • the SRX will perform NAT and will act as DHCP server for the home devices

Now, let’s look at how the SRX will be configured.

We assume minimal configuration is already in place: hostname, DNS, management access, etc…

First we configure interfaces.

My LAN facing interface will be:

set interfaces ge-0/0/0 unit 0 family inet address 192.168.111.1/24

My private LAN will be 192.168.111.0/24. Home devices will get an address from this subnet.

My internet facing interface will be:

set interfaces ge-0/0/1 unit 0 family inet address 172.30.124.59/24

All sessions from my home devices will reach their final destinations with this IP address as source address. This is done by configuring Source NAT interface on the SRX.

The SRX is a statefull firewall. This requires us to configure some security-related stanzas.

We start from the security zones. A security zone is a collection of interfaces with similar security requirements; for example, a collection of interfaces collecting the SRX to the PCs a specific branch department which must be treated similarly from a security point of view.

Zones, as we will see, are also used to build security objects like NAT rules and security policies.

We configure a LAN zone, including the LAN facing interface:

set security zones security-zone internet host-inbound-traffic system-services all
set security zones security-zone internet host-inbound-traffic protocols all
set security zones security-zone internet interfaces ge-0/0/1.0

Host inbound settings specify which traffic destined to the SRX (not traffic towards Internet) can be acceppted. Here, for simplicity, we allow everything but we might be more specific and tell the SRX to only allow ping and bgp.

Please check here for further information:

Internet facing zone is almost identical; the only difference is the included interface:

set security zones security-zone lan host-inbound-traffic system-services all
set security zones security-zone lan host-inbound-traffic protocols all
set security zones security-zone lan interfaces ge-0/0/0.0

Next, we configure the NAT rule:

set security nat source rule-set int from zone lan
set security nat source rule-set int to zone internet
set security nat source rule-set int rule 1 match source-address 192.168.111.0/24
set security nat source rule-set int rule 1 match destination-address 0.0.0.0/0
set security nat source rule-set int rule 1 then source-nat interface
  • it only applies to traffic from lan zone to internet zone
  • only traffic whose source address belongs to my LAN address space
  • we accept every possible destination address (0.0.0.0/0)
  • matching traffic will be translated by changing the original source address to the one configured on the egress interface (ge-0/0/1 in our scenario). This technique is called Source NAT interface

NAT rule simply tells us how to translate traffic from LAN to internet.

We still need to configure a security policy telling which traffic can traverse the SRX.

By default all traffic is denied.

We configure an entry in our address book representing our LAN address space:

set security address-book global address lan 192.168.111.0/24

Next, we configure the actual policy:

set security policies from-zone lan to-zone internet policy OK match source-address lan
set security policies from-zone lan to-zone internet policy OK match destination-address any
set security policies from-zone lan to-zone internet policy OK match application any
set security policies from-zone lan to-zone internet policy OK then log session-init
set security policies from-zone lan to-zone internet policy OK then log session-close
  • policy is for traffic from lan to internet
  • only traffic whose source address belongs to the LAN subnet matches this policy
  • all applications (http, dns, ftp, etc…) are acceppted
  • traffic is permitted
  • we create log entries every time a session is created (or denied) or closed.

As we said, the SRX implicitly denies all traffic not permitted by a security policy. This means that traffic originated on the Internet will be denied (we do not accept connections from the external world).

Return traffic for sessions created by our home devices (my PC browsing the Internet) are allowed as those sessions were originated from the LAN (matches the “from zone lan to zone internet” policy).

We still miss one thing: DHCP!

First we configure the pool:

set access address-assignment pool lan family inet network 192.168.111.0/24
set access address-assignment pool lan family inet range subnet1 low 192.168.111.10
set access address-assignment pool lan family inet range subnet1 high 192.168.111.19
set access address-assignment pool lan family inet dhcp-attributes router 192.168.111.1
set access address-assignment pool lan family inet dhcp-attributes name-server 8.8.8.8
  • we specify the subnet range along with the allocation pool (from .10 to .19)
  • we let home device know the LAN gateway address through the “router” DHCP attribute
  • we also configure a DNS server address which is communicated to the home device

Finally, we tell the SRX to be a DHCP server on the LAN facing interface:

set system services dhcp-local-server group lan interface ge-0/0/0

That’s all we need!

Now, let’s move to the home device. In this case an Ubuntu machine.

We clean any previous interface configuration and bring down the interface:

root@tonto:/home/tonto# ip addr flush dev eth1
root@tonto:/home/tonto# ifconfig eth1 down

We check we have no 0/0 route (we only have management routing that does not allow us to reach the internet):

root@tonto:/home/tonto# route
Kernel IP routing table
Destination Gateway Genmask Flags Metric Ref Use Iface
172.16.0.0 172.30.124.1 255.240.0.0 UG 0 0 0 eth0
localnet * 255.255.255.0 U 0 0 0 eth0

root@tonto:/home/tonto# ping 8.8.8.8 -c 3
connect: Network is unreachable

We bring the interface up and verify it has no IP address:

root@tonto:/home/tonto# ifconfig eth1 up

root@tonto:/home/tonto# ip add
3: eth1:  mtu 1500 qdisc pfifo_fast state UP group default qlen 1000
link/ether 52:54:00:37:8e:7d brd ff:ff:ff:ff:ff:ff

Now, we launch the dhcp client on our home device:

root@tonto:/home/tonto# dhclient eth1
root@tonto:/home/tonto# ip add
3: eth1:  mtu 1500 qdisc pfifo_fast state UP group default qlen 1000
link/ether 52:54:00:37:8e:7d brd ff:ff:ff:ff:ff:ff
inet 192.168.111.10/24 brd 192.168.111.255 scope global eth1
valid_lft forever preferred_lft forever

The interface now has an address, the first one available in the allocation pool!

We also captured the DHCP dialogue using tcpdump:

root@tonto:/home/tonto# tcpdump -i eth1
tcpdump: verbose output suppressed, use -v or -vv for full protocol decode
listening on eth1, link-type EN10MB (Ethernet), capture size 65535 bytes
17:25:25.191653 IP 0.0.0.0.bootpc > 255.255.255.255.bootps: BOOTP/DHCP, Request from 52:54:00:37:8e:7d (oui Unknown), length 300
17:25:26.179032 IP 192.168.111.1.bootps > 192.168.111.10.bootpc: BOOTP/DHCP, Reply, length 275
17:25:26.179536 IP 0.0.0.0.bootpc > 255.255.255.255.bootps: BOOTP/DHCP, Request from 52:54:00:37:8e:7d (oui Unknown), length 300
17:25:26.621412 IP 192.168.111.1.bootps > 192.168.111.10.bootpc: BOOTP/DHCP, Reply, length 275
17:25:27.642985 ARP, Request who-has 192.168.111.1 tell 192.168.111.10, length 28
17:25:27.644412 ARP, Reply 192.168.111.1 is-at 52:54:00:96:6e:a5 (oui Unknown), length 28

And we verify the binding on the SRX:

root@JNCP> show dhcp server binding
IP address Session Id Hardware address Expires State Interface
192.168.111.10 1 52:54:00:37:8e:7d 86384 BOUND ge-0/0/0.0

You can easily see that is the eth1 MAC address.

Finally we try to ping the Internet from the home device:

root@tonto:/home/tonto# ping pastaecompany.it
PING pastaecompany.it (185.56.218.12) 56(84) bytes of data.
64 bytes from web26.keliweb.com (185.56.218.12): icmp_seq=1 ttl=50 time=42.5 ms
64 bytes from web26.keliweb.com (185.56.218.12): icmp_seq=2 ttl=50 time=42.4 ms
64 bytes from web26.keliweb.com (185.56.218.12): icmp_seq=3 ttl=50 time=42.8 ms
^C
--- pastaecompany.it ping statistics ---
3 packets transmitted, 3 received, 0% packet loss, time 2002ms
rtt min/avg/max/mdev = 42.476/42.623/42.806/0.274 ms

We can ping “Pasta & Company” as expected!

What can we do more?

In this scenario we had an intermediate device: the switch. SRX branch devices have multiple revenue ports (for example SRX340 has ge-0/0/0 up to ge-0/0/7)

We might move to this new scenario:

no_switch

Here, home devices are directly connected to the SRX. How does our configuration change?

First, we need to configure 2 L2 interface that will connect the SRX to our home devices:

set interfaces ge-0/0/0 unit 0 family ethernet-switching vlan members lan
set interfaces ge-0/0/2 unit 0 family ethernet-switching vlan members lan

Interfaces are access interfaces, part of a vlan called “lan”.

We also configure the gateway of our LAN. This time, this address is not configured on a physical interface (ge) but on a “virtual L2” interface called IRB:

set interfaces irb unit 0 family inet address 192.168.111.1

Next, we define the vlan:

set vlans lan vlan-id 100
set vlans lan l3-interface irb.0
  • vlan-id is more of a placeholder as traffic will likely be untagged on the device-srx path. Anyhow, ge interfaces might be configured as trunk and accept tagged packets
  • we associate the IRB to the vlan; this way we tell the SRX that irb.0 will act as the gateway of the LAN and will be used to route traffic from lan to internet

LAN zone must be changed in order to include the irb interface instead of the ge interfaces:

set security zones security-zone lan host-inbound-traffic system-services all
set security zones security-zone lan host-inbound-traffic protocols all
set security zones security-zone lan interfaces irb.0

DHCP pool definition remains the same. What changes is this:

set system services dhcp-local-server group lan interface irb.0

We now have to associate DHCP local server with the IRB interface (no more ge-0/0/1)

Migrating to this configuration requires the SRX to run in so called “switching” mode. Please have a look here https://www.juniper.net/documentation/en_US/junos/topics/concept/security-layer2-bridging-switching-overview.html to learn the theory. Simply put, switching mode allows us to have L2 interfaces using an IRB as “virtual gateway” and pass through the IRB interface to route traffic to a L# interface that sends traffic upstream.

In newer versions, switching mode is the default mode. It might not be the case with some older versions. If so, you need to configure switching mode by setting:

set protocols l2-learning global-mode switching

After committing, it is required to reboot the device.

Anyhow, before deploying, check if your model and version support switching mode or not and, if so, whether it is the default one or not.

Is this it?

Of course not! We showed some basic examples where the upstream interface was an Ethernet interface configured with a static IP address.

That interface might be client for an upstream DHCP server. In this case, change your configuration as follows:

set interfaces ge-0/0/1 unit 0 family inet dhcp

Syntax might change in different Junos versions.

What more?

Juniper branch devices can be equipped with additional modules called PIM modules. One of these modules is the miniPIM VDSL module. This module allows us to configure the SRX in order to use ADSL or VDSL for the upstream interface.

Check this KB for a sample ADSL configuration: https://kb.juniper.net/InfoCenter/index?page=content&id=KB15737&actp=METADATA . This KB is a bit outdated (DHCP configuration is old and different from what we have seen. Anyhow, it is useful to have a look about ADSL specific interface relying on PPPoE (which is current 🙂 )!

Here are some useful links to learn more about ADSL:

As said before, the miniPIM module can also be used to connect to the Internet using the VDSL technology.

I worked on a test campaign using SRX as VDSL CPE. There, we simply used static IP configuration on the VDSL interface (vlan tagged). Here is the required configuration:

set interfaces pt-1/0/0 per-unit-scheduler
set interfaces pt-1/0/0 vlan-tagging
set interfaces pt-1/0/0 vdsl-options vdsl-profile 17a
set interfaces pt-1/0/0 unit 0 vlan-id 835
set interfaces pt-1/0/0 unit 0 family inet address 40.40.40.10/30

As you can see, we can configure standard COS on the VDSL (pt) interface.

This is a non-tested VDSL configuration using PPPoE with CHAP (use with care):

set interfaces pt-1/0/0 vdsl-options vdsl-profile auto
set interfaces pt-1/0/0 vdsl-options vdsl-profile 17a
set interfaces pt-1/0/0 unit 0 encapsulation ppp-over-ether
set interfaces pt-1/0/0 vlan-tagging
set interfaces pt-1/0/0 unit 0 vlan-id 100
set interfaces pp0 unit 0 ppp-options chap default-chap-secret india local-name locky passive
set interfaces pp0 unit 0 pppoe-options underlying-interface pt-1/0/0.0 auto-reconnect 120 client
set interfaces pp0 unit 0 family inet negotiate-address
set routing-options static route 0.0.0.0/0 next-hop pp0.0

Check here https://www.juniper.net/documentation/en_US/junos/topics/concept/vdsl2-pim-security-low-range-services-gateway-support.html for further information.

Please notice that the miniPIM module supports both ADSL and VDSL. Simply configure the at interface to run in ADSL mode or configure the pt interface to run it in VDSL mode. Obviously, you cannot run both ADSL and VDSL at the same time.

Done? Well yes, but let me tell one more thing…we have dealt with connectivity so far but remember the SRX is a firewall. This means it can offer value-added services!

What can we add?

  • Anti Virus
  • Anti Spam
  • Web filtering
  • Advanced anti malware protection
  • Content filtering
  • IPS
  • Application aware firewall, QOS
  • Application tracking
  • On box reporting (see here)
  • and more…

This means we will not have a CPE…but a secure CPE…which is better, right?

And now we are done!

Ciao
IoSonoUmberto

A journey into SRX on box reporting…from GUI to CLI to automation

Starting version 15.1X49, Juniper enhanced SRX Jweb GUI and its reporting capabilities.

This means being able to have the SRX to create reports about firewall top talkers, anti virus hits, web filtering blocked URLs and so on.

Creating a report is pretty easy. First, we need to enable security logging on the SRX. Here, I am using a vSRX.

Minimal needed configuration:

set security log utc-timestamp
set security log mode stream
set security log format sd-syslog
set security log report

As mentioned, we have several types of reports (firewall, IPS, anti virus, web filtering, etc…). In this post we are going to make an example using web filtering. For this reason, we configure Enhanced Web Filtering (EWF) on vSRX:

set security utm feature-profile web-filtering url-blacklist loc_wf_bl_cat
set security utm feature-profile web-filtering type juniper-enhanced
set security utm feature-profile web-filtering juniper-enhanced profile WCF1 category Enhanced_Sex action block
set security utm feature-profile web-filtering juniper-enhanced profile WCF1 category Enhanced_Gambling action block
set security utm feature-profile web-filtering juniper-enhanced profile WCF1 default log-and-permit
set security utm feature-profile web-filtering juniper-enhanced profile WCF1 custom-block-message "Blocked by vSRX EWF!"
set security utm feature-profile web-filtering juniper-enhanced profile WCF1 fallback-settings default log-and-permit
set security utm custom-objects url-pattern loc_wf_bl_pat value http://*.sscnapoli.it
set security utm custom-objects custom-url-category loc_wf_bl_cat value loc_wf_bl_pat

What have we configured?

  • we configured a custom blacklist including a website we consider dangerous: Napoli football club website
  • we use the Enhanced Web Filtering engine; vSRX needs to have internet connectivity to reach remote cloud web filtering server in order to get a category for a specific URL (unless included in the custom blacklist)
  • we block two categories of URLs: gambling and sex

Next, we enable Jweb:

set system services web-management http interface ge-0/0/1.0

Be also sure, if a revenue port (ge, xe) port is used, to correctly configure host-inbound-traffic within the zone. For example, this allows everything:

set security zones security-zone internet host-inbound-traffic system-services all
set security zones security-zone internet host-inbound-traffic protocols all
set security zones security-zone internet interfaces ge-0/0/1.0

Now, let’s connect to the Jweb page :

jweb1

from the left menu we go to the Report section:

jweb2

Here we can see a lot of available reports. These are pre-built and pre-defined reports. It is not possible to create custom reports on Jweb. This capability is offered by Juniper Security Director. Anyhow, the available reports are enough to cover the most common requirements and use-cases.

We select a report about URLs and we configure Description, Time span and other options:

jweb3

As a result, a HTML file is generated. We can open it directly into the browser and start looking at its content.

This specific report is pretty complex and includes a lot of information and sub-reports. One of them tells us the top Blocked URLs. Both a bar chart and a table are available:

jweb4

This looks great and for the average user is more than ok!

But what if we want more?

Let’s start from this imagejunosxml

Users normally use CLI to “talk” with Junos. CLI is designed to provide user friendly output. Anyhow, internally, Junos is XML native: all the information is saved and organized in XML format. Junos always translates a CLI command into a RPC. This RPC is organized in XML as well and is the actual command sent to the mgd daemon.

We do not go into details here…it would require too much time. The key concepts here are: Junos is XML native and CLI commands are translated into RPCs.

Now, let’s replace the end user with Jweb!

junosrpc

The end result does not change:

  • Jweb will internally translate the user actions into a CLI command
  • That CLI command will be translated into a RPC
  • Junos mgd will process the RPC and reply with a RPC reply organized in XML format

What now? We start looking for the CLI command!

Achieving this is pretty easy; we simply need to monitor the interactive-commands logfile while generating reports via Jweb:

root@JNCP:~ # tail -f /var/log/interactive-commands | grep show-security-log-report
Nov 6 21:14:54 JNCP mgd[22567]: UI_JUNOSCRIPT_CMD: User 'root' used JUNOScript client to run command 'show-security-log-report-top log-set=utm-webfilter-blocked start-from=0 count=10 group-by=category order-by=count start-time=2018-11-05T21:14:54+0000 stop-time=2018-11-06T21:14:54+0000'
Nov 6 21:14:56 JNCP mgd[22565]: UI_JUNOSCRIPT_CMD: User 'root' used JUNOScript client to run command 'show-security-log-report-top log-set=utm-webfilter-blocked start-from=0 count=10 group-by=user order-by=count with=url start-time=2018-11-05T21:14:56+0000 stop-time=2018-11-06T21:14:56+0000'
Nov 6 21:14:57 JNCP mgd[22575]: UI_JUNOSCRIPT_CMD: User 'root' used JUNOScript client to run command 'show-security-log-report-in-interval log-set=utm-webfilter start-time=2018-11-05T21:14:57+0000 stop-time=2018-11-06T21:14:57+0000'
Nov 6 21:14:59 JNCP mgd[22577]: UI_JUNOSCRIPT_CMD: User 'root' used JUNOScript client to run command 'show-security-log-report-top log-set=utm-webfilter-blocked start-from=0 count=10 group-by=url order-by=count start-time=2018-11-05T21:14:59+0000 stop-time=2018-11-06T21:14:59+0000'
Nov 6 21:15:05 JNCP mgd[22593]: UI_JUNOSCRIPT_CMD: User 'root' used JUNOScript client to run command 'show-security-log-report-top log-set=utm-webfilter-permitted start-from=0 count=10 group-by=category order-by=count start-time=2018-11-05T21:15:05+0000 stop-time=2018-11-06T21:15:05+0000'
Nov 6 21:15:08 JNCP mgd[22596]: UI_JUNOSCRIPT_CMD: User 'root' used JUNOScript client to run command 'show-security-log-report-top log-set=utm-webfilter-permitted start-from=0 count=10 group-by=category order-by=volume start-time=2018-11-05T21:15:08+0000 stop-time=2018-11-06T21:15:08+0000'
Nov 6 21:15:10 JNCP mgd[22606]: UI_JUNOSCRIPT_CMD: User 'root' used JUNOScript client to run command 'show-security-log-report-top log-set=utm-webfilter-permitted start-from=0 count=10 group-by=url order-by=volume start-time=2018-11-05T21:15:10+0000 stop-time=2018-11-06T21:15:10+0000'
Nov 6 21:15:12 JNCP mgd[22605]: UI_JUNOSCRIPT_CMD: User 'root' used JUNOScript client to run command 'show-security-log-report-top log-set=utm-webfilter-permitted start-from=0 count=10 group-by=url order-by=count start-time=2018-11-05T21:15:12+0000 stop-time=2018-11-06T21:15:12+0000'

We get a pretty long list. This happens because, as we said, we chose a report that is actually made of multiple reports. For each sub-report we have a log entry with the corresponding CLI command.

Let’s choose the one corresponding to the “Top Blocked URLs” table we saw before.

Nov 6 21:14:59 JNCP mgd[22577]: UI_JUNOSCRIPT_CMD: User 'root' used JUNOScript client to run command 'show-security-log-report-top log-set=utm-webfilter-blocked start-from=0 count=10 group-by=url order-by=count start-time=2018-11-05T21:14:59+0000 stop-time=2018-11-06T21:14:59+0000'

We “de-compose” it in order to understand how the CLI command is built.

We have the RPC:

show-security-log-report-top

And the list of arguments:

log-set=utm-webfilter-blocked
start-from=0
count=10
group-by=url
order-by=count
start-time=2018-11-05T21:14:59+0000
stop-time=2018-11-06T21:14:59+0000

Now we have much more information and we can try running the CLI command:

root@JNCP> show security log rep
^
syntax error.

In some versions, like the one I am running, the “report” command is hidden, you need to write it by hand, auto-completion will not work!

show security log report top utm-webfilter-blocked start-from 0 count 10 group-by url order-by count start-time 2018-11-05T21:14:59+0000 stop-time 2018-11-06T21:14:59+0000

root@JNCP> ...locked start-from 0 count 10 group-by url order-by count start-time 2018-11-05T21:14:59+0000 stop-time 2018-11-06T21:14:59+0000
Total-count: 10
Url Count Volume(MB) Url-category User-number
------------------------------------------------------------------
www.sscnapoli.it 24 0.000000 loc_wf_bl_cat 1
www.888.com 12 0.000000 Enhanced_Gambling 1
www.snai.it 6 0.000000 Enhanced_Gambling 1
www.youporn.com 3 0.000000 Enhanced_Sex 1
www.pornhub.com 1 0.000000 Enhanced_Sex 1
www.xvideos.com 1 0.000000 Enhanced_Sex 1

We obtain the table we had in the HTML report file generated by Jweb. This is expected…the Jweb HTML report is built on this data!

We said before that Junos is XML native. This also means that behind every CLI command there is a RPC. In Junos we have a command to find the RPC, “| display xml rpc”:
rpc

This output should look familiar by now. We have the same information we saw before when looking inside the interactive-commands logfile.
We can also look at the Junos native XML reply, before it is converted to CLI output. This time we simply use “| display xml”:
xml
Where are we now? We created reports via Jweb in HTML and we also understood how to get report information via CLI. But is this it?
Getting information via CLI is possible but is it really useful and practical? Probably not, de gustibus 🙂 Anyhow, the important thing we learned by working with CLI is how to translate CLI commands into a RPC…and where do RPCs lead us? Yes…automation!
And this is our last step!
We now want to obtain reporting information using Python so that data collection can be automated!
Here we are going to use Juniper free python automation suite: PyEz. Installing PyEz is out of the scope of this post but you can find more here https://www.juniper.net/documentation/en_US/junos-pyez/topics/task/installation/junos-pyez-server-installing.html
Here is a snippet of how we can use PyEz to run a RPC.
First we load modules:

Python 3.6.1 (default, Oct  2 2017, 20:46:59)
[GCC 6.3.0] on linux
Type "help", "copyright", "credits" or "license" for more information.
>>> from jnpr.junos.factory.factory_loader import FactoryLoader
>>> import yaml
>>> from jnpr.junos import Device

We connect to the device:

>>> dev=Device(host="172.30.144.59",user="root",password="Juniper123")
>>> dev.open()
Device(172.30.144.59)

We run the RPC. Notice that, within the RPC name, we had to replace “-” with “_” as python expects to compute a difference when encountering a “-” symbol:

>>> urls=dev.rpc.show_security_log_report_top(log_set="utm-webfilter-blocked",start_from="0",count="10",group_by="url",start_time="2018-11-05T21:14:59+0000",stop_time="2018-11-06T22:29:59+0000",order_by="count")

Arguments are specified within “()”. Again, use “_” instead of “-“.
Next, we use standard XML manipulation functions to navigate and extract information from the RPC reply which, as said before, is organized as a XML tree:

>>> sites=urls.xpath(".//security-log-report-top-header/text()")

We can print the list of Blocked URLs:

>>> sites
['\nwww.sscnapoli.it\n', '\nwww.facebook.com\n', '\nwww.888.com\n', '\nwww.snai.it\n', '\nwww.pornhub.com\n', '\nshavar.services.mozilla.com\n', '\nwww.xvideos.com\n', '\nwww.youporn.com\n', '\nsafebrowsing.googleapis.com\n', '\nwww.tubegalore.com\n']

For each entry we can print tags and their texts. These are the values we normally find in the report table:

>>> urls[1][0].tag
'security-log-report-top-header'
>>> urls[1][0].text
'\nwww.sscnapoli.it\n'
>>> urls[1][1].tag
'security-log-report-top-count'
>>> urls[1][1].text
'\n24\n'

We said this was the last step…well, it was a white lie 🙂 We want to add one more little piece: PyEz tables and views. This tool allows us to get the RPC reply and organize it into a python dictionary, only containing the information we want.
To find out more about tables and views, please have a look here https://www.juniper.net/documentation/en_US/junos-pyez/topics/concept/junos-pyez-tables-and-views-overview.html
First, we need to define the table and view. We do this through a YAML file:

BlockedUrl:
 rpc: show_security_log_report_top
 args:
   log-set: 'utm-webfilter-blocked'
   start-from: '0'
   count: '10'
   group-by: 'url'
   order-by: 'count'
 item: security-log-report-top-entry
 key: security-log-report-top-header
 view: BlockedUrlView
 
BlockedUrlView:
 fields:
  site: security-log-report-top-header
  hits: security-log-report-top-count
  reason: security-log-report-top-add-output
  • we specify the RPC
  • we also specify arguments, excluding start and stop time
  • we tell PyEz to group the XML reply in blocks: blocks are identified via the item variable
  • we use the URL as key because of its uniqueness
  • within the view definition we specify which fields from the XML block must be saved within the dictionary. Here we store the URL, the number of HITS and the reason for blocking the request

In order to better understand concepts like item, key and view fields please recall the XML structure of the RPC reply:
xml
This is the python code using the table and view:

>>> from jnpr.junos import Device
>>> dev=Device(host="172.30.144.59",user="root",password="Juniper123")
>>> dev.open()
Device(172.30.144.59)
>>> fp=open("blockedurl.yml")
>>> yml=fp.read()
>>> fp.close()
>>> globals().update(FactoryLoader().load(yaml.load(yml)))
>>> data=BlockedUrl(dev).get(start_time="2018-11-05T21:14:59+0000",stop_time="2018-11-06T22:29:59+0000")
>>> data
BlockedUrl:172.30.144.59: 10 items
>>> data.keys()
['www.sscnapoli.it', 'www.facebook.com', 'www.888.com', 'www.snai.it', 'www.pornhub.com', 'shavar.services.mozilla.com', 'www.xvideos.com', 'www.youporn.com', 'safebrowsing.googleapis.com', 'www.tubegalore.com']
>>> data['www.sscnapoli.it'].keys()
dict_keys(['site', 'hits', 'reason'])
>>> data['www.sscnapoli.it']['hits']
'24'
>>> data['www.sscnapoli.it']['reason']
'loc_wf_bl_cat'

As you can see we have a dictionary whose keys are the blocked URLs. Then , for each URL we can see the number of hits and the reason.
Moreover, you may have noticed we passed two additional arguments, start and stop time, when “getting” data from the device. The idea here is to further abstract this by making those two arguments as variables and have the user provide that actual values as the script parameters. This helps making the script more automation friendly and re-usable over time.
We used Python here but Juniper also provides an Ansible module (relying on python) to run RPCs against a Juniper device. This means extending on-box reporting capabilities up to a sophisticated and well-spread free orchestration tool like Ansible!
What’s next? Well…

  • we know how to obtain the CLI command to create a report
  • we know how to translate the CLI command to a RPC request
  • we know how to use that RPC to import data into a python script

From here, it is just a matter of how we want to process and use that data within our automation tool…sky is the limit!
We are ready to master new SRX on-box reporting capabilites…Jweb, CLI, integration with automation tools using popular solutions like Python or Ansible! Multiple possibilities to monitor and get insights about your network and the traffic traversing it!
That’s all for today! HAppy reporting 🙂
IoSonoUmberto